Model answer by Lifestyle Training Centre
The given tables illustrate how the population of New York City changed between 1800 and 2000, and how this population was distributed across its five boroughs: Manhattan, Brooklyn, Queens, the Bronx, and Staten Island.
Over the course of two centuries, the city’s population grew dramatically. Although Manhattan accounted for the majority of residents in the early period, its relative share steadily diminished as the other boroughs expanded more rapidly and absorbed the bulk of the population increase.
In 1800, New York City had a total population of 79,216, of which Manhattan alone accounted for 60,515 — approximately 76%. The combined population of the other four boroughs was just 18,701, representing 24% of the total. By 1900, the population had risen steeply to 3,437,202. While Manhattan remained the most populous borough with 1,850,093 residents (54% of the city’s total), the share of the other boroughs had increased to 46%, collectively housing 1,587,109 people.
By 2000, the city’s population had reached 8,009,185. Notably, Manhattan’s population had declined to 1,538,096 — just 19% of the total — while the combined population of the other boroughs soared to 6,471,089, representing 81%. This marks a profound demographic shift in the urban landscape of New York City.
📘 Vocabulary List with Meanings
| Word/Phrase | Meaning |
|---|---|
| evolved | Gradually changed or developed over time |
| distributed | Divided or spread across different areas |
| boroughs | Administrative divisions of a large city (used in New York City) |
| dominated | Had the most power, control, or importance |
| in terms of | Regarding; with reference to a particular thing |
| proportion | A part or share of the whole, often expressed as a percentage |
| steadily | Gradually and consistently over time |
| prominent | Important or well-known |
| amounting to | Totaling; equalling a particular number or value |
| respectively | In the same order as previously mentioned |
| inhabitants | People who live in a particular place |
| followed | Came next in order |
| significant | Important or large enough to be noticed |
| declined | Decreased or reduced |
| reflecting | Showing or indicating something clearly |
| demographic shift | A major change in the makeup of a population |
🔍 Key Insights from the Sample IELTS Table Report
📌 1. Start with a Clear Introduction
- What to do: Paraphrase the question.
- Why it works: Shows the examiner you understand the data.
- ✅ Example: “The given tables illustrate how the population of New York City changed between 1800 and 2000…”
📌 2. Write an Effective Overview
- What to do: Identify overall trends without using data.
- Why it works: The overview is critical for Band 7+.
- ✅ Example: “Over the course of two centuries, the city’s population grew dramatically…”
📌 3. Use Data to Support Trends (Body Paragraphs)
- Group by years (1800 → 1900 → 2000).
- Compare boroughs — focus on how their share changed.
- Include exact numbers and percentages.
- ✅ Example: “In 1800, Manhattan alone accounted for 60,515 — approximately 76%.”
📌 4. Highlight Shifts in Proportions
- Track percentage changes across years.
- Note growth vs decline in both numbers and share.
- ✅ Observation: Manhattan’s share dropped from 76% → 54% → 19%.
📌 5. Use Formal, Comparative Language
- Verbs like accounted for, represented, soared, declined, remained, absorbed, marked.
- Avoid casual or descriptive-only language like big, small, a lot.
📌 6. Keep the Tone Objective & Quantitative
- Focus on what the numbers show, not opinions.
- Avoid: “It’s surprising that…” or “This shows how…”
- ✅ Correct approach: “…the combined population of the other boroughs soared to 6,471,089…”
📌 7. Structure Matters
Suggested paragraphing:
- Intro (paraphrase)
- Overview (summary of trends)
- Body 1: Data from 1800 & 1900
- Body 2: Data from 2000 and comparison
✍️ Summary Tips:
| Do | Don’t |
|---|---|
| Use specific figures and % | Use vague phrases like “a lot” |
| Group data logically | Jump between years randomly |
| Write an overview | Skip overview (Band 5–6 risk) |
| Use formal academic tone | Write like a casual blog or story |
| Compare changes across years | Only describe data without contrast |
This type of structured, data-driven response is essential to reach Band 8+. The key is accuracy, comparison, and clarity—with no room for opinion or fluff.
IELTS Academic Writing Task 1 Types
Explore and prepare for different chart types used in IELTS Task 1
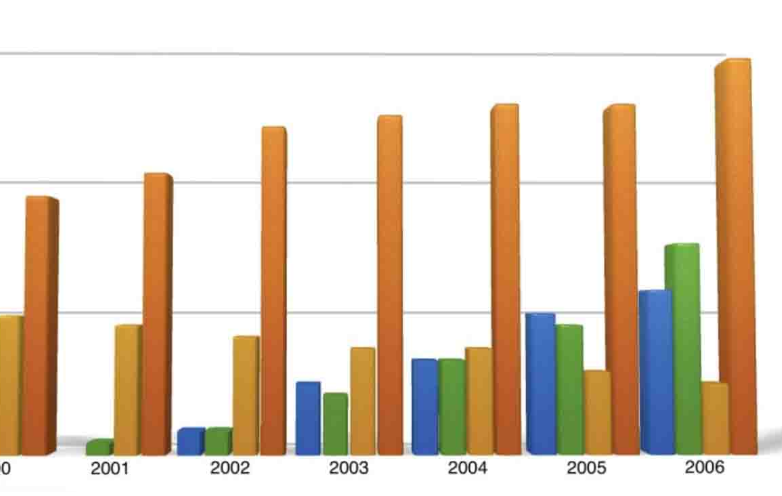
IELTS Bar Charts
Understand how to interpret and describe bar charts in task 1.

IELTS Pie Charts
Learn the techniques for describing pie charts in detail.

IELTS Line Graph
Get tips on how to describe trends using line graphs.
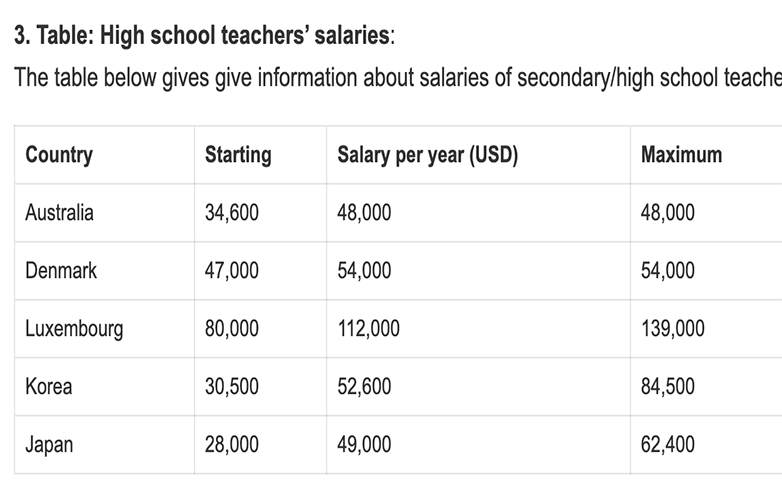
IELTS Table
Master the skills to describe tables in academic writing.
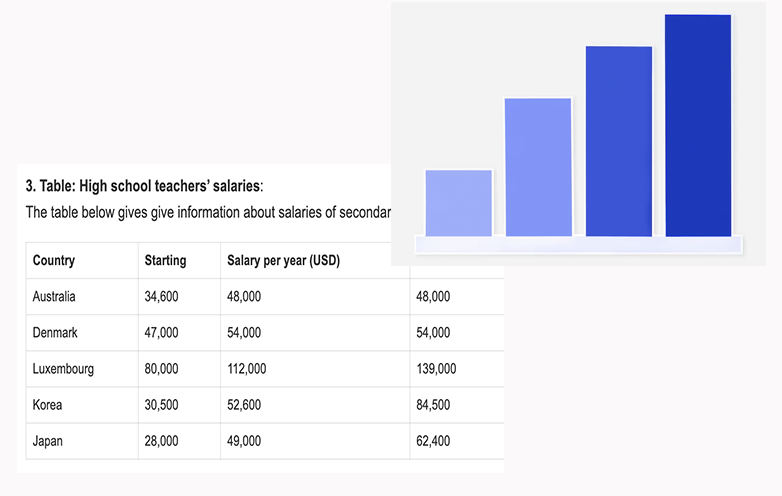
IELTS Bar Chart + Table
Learn how to combine bar charts with tables in task 1 responses.
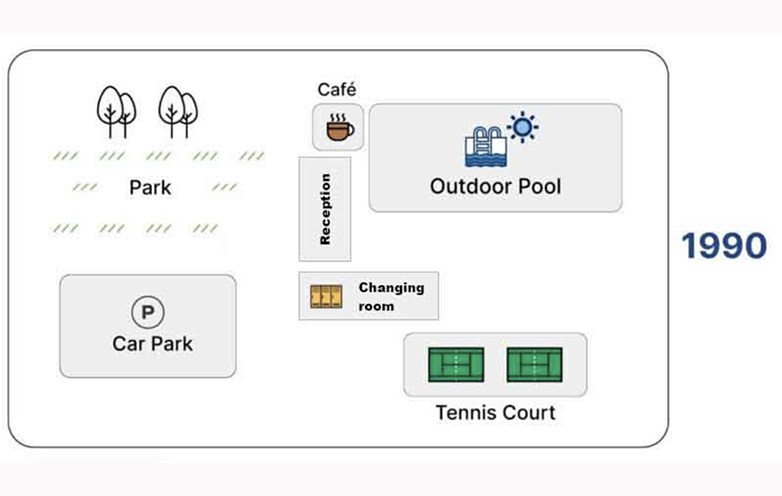
IELTS Maps
Explore how to describe maps and geographical changes.
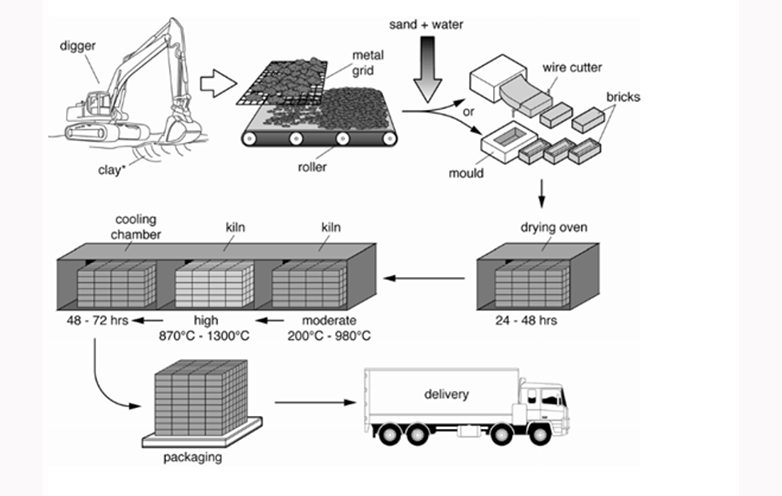
IELTS Process Diagram
Understand how to write about process diagrams step by step.
IELTS Bar Chart + Line Graph
Learn how to integrate bar charts with line graphs.

IELTS Bar Chart + Pie Chart
Master combining bar charts with pie charts in task 1.
Free admission and English Courses. കാശ് കൊടുക്കാതെ അഡ്മിഷൻ. FREE ഇഗ്ലീഷ് കോഴ്സുകൾ. ഈ ഓഫർ നേടൂ. Contact us at +91 9886926773 പ്രോസസ്സിംഗ് ആയാസകരം.

Speak English with Pride – Not Hesitation! Join Our Intensive Batch – Fluency, Accent & Confidence in 1 Month. Starts Feb 17 | Call/WhatsApp: +91 9886926773 Now. #fluency #accent #English

Ready to study abroad or master OET, PTE, IELTS, Duolingo, Phonetics, or Spoken English?
📞 Call us now at +91 9886926773
📱 Call/WhatsApp/Text: +91 9886926773
📧 Email: mail@goltc.in
Visit us in person by following the directions on Google Maps. We look forward to welcoming you to the Lifestyle Training Centre.
Follow Lifestyle Training Centre on social media:
Thank you very much!