Question no: 8
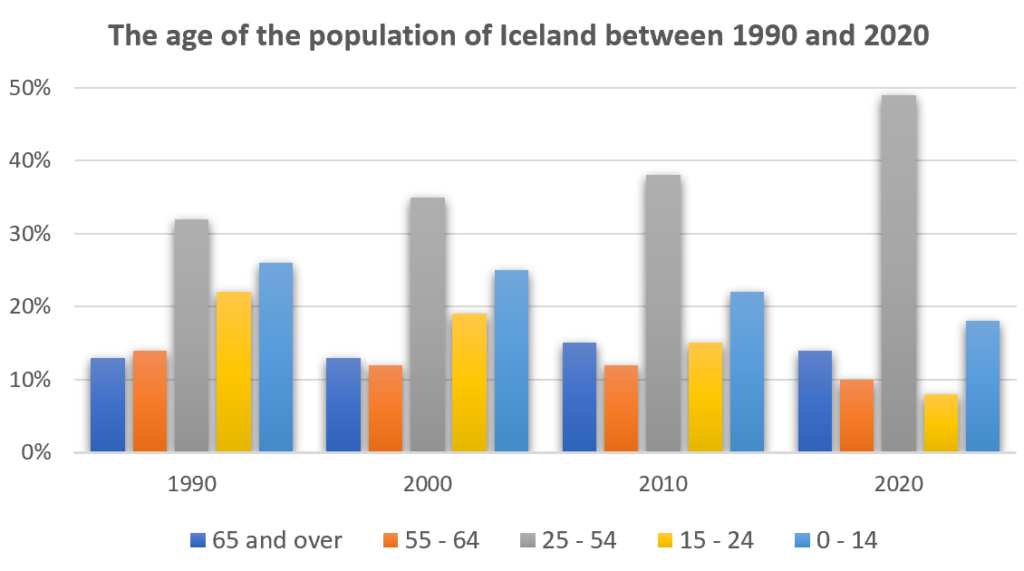
The graph gives information about the age of the population of Iceland between 1990 and 2020. Summarise the information by selecting and reporting the main features, and make comparisons where relevant.

Model answer by Lifestyle Training Centre
The bar chart meticulously illustrates the percentage distribution of five distinct age groups in Iceland across three decades, from 1990 to 2020.
Overall, the 25-54 age group consistently represented the largest portion of the population and increased steadily over the period, while most other age groups either declined or exhibited fluctuations.
In 1990, the 25-54 age group comprised approximately 32% of the population, a figure that rose significantly to nearly 50% by 2020. In contrast, the 15-24 age group, which initially accounted for around 21%, experienced a steady decrease, ultimately representing only 9% by 2020. Similarly, the 0-14 age group, constituting roughly 26% in 1990, gradually declined to around 19% by the end of the period.
The 55-64 and 65+ age groups were the smallest in 1990, at approximately 13% and 12%, respectively. The 65+ group remained stable until 2000, then increased to nearly 15% in 2010 before slightly declining to around 13% in 2020. Meanwhile, the 55-64 age group initially fell from about 13% in 1990 to 12% by 2010 and further reduced to 10% by 2020.
List of vocabulary used:
- Bar chart – A type of graph that uses bars to represent data values in different categories.
- Meticulously – Done with careful attention to detail.
- Illustrates – Shows or explains something clearly, often using visual aids.
- Percentage distribution – The proportion or share of different parts of a whole, expressed in percentages.
- Distinct – Clearly different or unique.
- Decades – Periods of ten years.
- Consistently – Occurring in the same way over time.
- Represented – Stood for or symbolised something.
- Portion – A part or fraction of a whole.
- Population – The total number of people in a specific area or group.
- Increased steadily – Grew in a gradual, constant manner.
- Declined – Decreased or went down.
- Exhibited – Showed or displayed.
- Fluctuations – Variations or changes in level, amount, or quantity.
- Comprised – Made up of or consisted of.
- Approximately – Close to a certain figure, but not exact.
- Significantly – To a notable or important degree.
- In contrast – Used to compare two things that are different.
- Initially – At the beginning.
- Accounted for – Made up or was responsible for a part of something.
- Experienced – Went through or underwent.
- Steady decrease – A continuous, gradual reduction.
- Ultimately – In the end; finally.
- Representing – Serving as an example or symbol of something.
- Constituting – Being a part of a whole.
- Roughly – Approximately; not exactly.
- Gradually – Happening slowly over time.
- End of the period – The final point in a given time span.
- Respectively – In the order mentioned.
- Stable – Not changing significantly over time.
- Increased to – Went up to a specific level.
- Declining – Going down or decreasing.
- Fell from – Decreased from a certain level.
- Further reduced – Decreased even more.
IELTS Speaking Task Topics
Click on any topic to explore more!
Names

Learn about the importance of names and their cultural significance.
Study / Job

Discuss various aspects of studying and working in different fields.
Hometown

Explore the charm of your hometown and its unique features.
Accomodation

Understand various types of accommodation and living situations.
Weather

Learn about how weather influences daily life and activities.
Time

Discuss the concept of time, its importance, and time management.
Television

Talk about the role of television in modern entertainment.
Museum

Discuss the cultural importance of museums and historical exhibits.
Holidays

Explore the significance of holidays and different celebrations.
Films

Learn about the impact of films on culture and society.
Leisure Time

Discuss how leisure activities impact personal well-being.
Sport

Talk about the role of sports in health, entertainment, and culture.
Vegetables and Fruits

Discuss the health benefits and importance of fresh produce.
Maths

Explore the role of mathematics in various aspects of life.
Sky

Discuss the beauty and scientific significance of the sky.
Clothes&Fashion

Explore how clothing reflects culture and personal expression.
Weekend

Discuss the importance of weekends and ways people relax.
Reading

Learn about the importance of reading and various reading habits.
Sleep

Explore how sleep impacts physical and mental well-being.
Trees&Plants

Discuss the environmental and health benefits of plants.
Newspaper

Discuss the evolving role of newspapers in the digital age.
Texting

Explore the role of text messaging in modern communication.
Memorising

Learn techniques for improving memory and memorization.
Travelling

Discuss the importance and impact of traveling in modern society.
Communication

Explore the modes and significance of communicating well
Letter&Email

Explore the differences and significance of letters vs. emails.
Swimming

Discuss the benefits of swimming for health and fitness.
Snacks

Explore the role of snacks in daily nutrition and lifestyle.
Photography

Discuss photography’s cultural and artistic significance.
Help

Talk about the importance of offering and receiving help.
History

Discuss historical events and their impact on modern society.
Handwriting

Explore the significance of handwriting in education and culture.
Music

Learn about the influence of music on emotions and society.
Colours

Discuss how colours affect perception and mood.
Teachers

Explore the role of teachers in shaping students’ futures.
Being Alone

Talk about the experience and benefits of spending time alone.
Teamwork

Learn the importance of teamwork in professional and social contexts.
Countryside & City

Explore the charm and benefits of living in the countryside.
Social Media

Discuss the impact of social media on society and relationships.
Friends

Explore the importance of friendships in life.
Artificial Intelligence (AI)

Talk about the future of AI and its role in society.
Climate Change

Discuss the causes and consequences of climate change.
Transportation

Explore different modes of transportation in your area.
Sustainable Transportation

Explore ways to make transportation more environmentally friendly.
Space Exploration

Learn about the latest advancements in space exploration.
Shopping

Explore how shopping influences culture and the economy.
Modern Technology

Discuss how modern technology is reshaping society.
Technology

Learn about the role of technology in everyday life.
Sustainable Living

Explore ways to live sustainably for the future of the planet.
Globalisation

Learn about the effects of globalisation on society and economies.
Global Warming

Discuss the causes, effects, and solutions to global warming.
Gender Equality

Explore the importance of gender equality in modern society.
Health and Fitness

Discuss the importance of maintaining a healthy lifestyle.
Renewable Energy

Learn about renewable energy sources and their impact on the environment.
Cultural Traditions in Kerala

Explore the unique cultural traditions of Kerala, your hometown.
Cultural Traditions in Your Country

Learn about the cultural traditions in your country.
Education System

Discuss the education system in your country and its effectiveness.
Traditional Cuisine

Explore the significance of traditional cuisines in your culture.
Do you need printed IELTS/ OET practice material? Place your order today. Available now for just Rs: 1,100 (including shipping all across India) Contact us at our WhatsApp number: +91 9886926773 to place your order. (Free for LTC students)

We hope this information has been valuable to you. If so, please consider a monetary donation to Lifestyle Training Centre via UPI. Your support is greatly appreciated.

Would you like to undergo training for OET, PTE, IELTS, Duolingo, Phonetics, or Spoken English with us? Kindly contact us now!
📱 Call/WhatsApp/Text: +91 9886926773
📧 Email: [email protected]
Visit us in person by following the directions on Google Maps. We look forward to welcoming you to the Lifestyle Training Centre.
Follow Lifestyle Training Centre on social media:
Thank you very much!