Employment sectors of graduates IELTS writing task 1
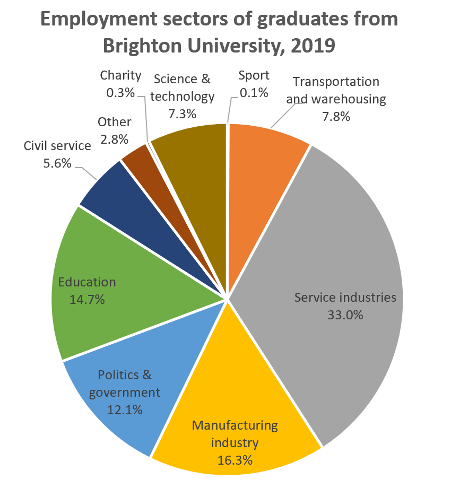
6. Employment sectors of graduates The chart below shows the proportions of graduates from Brighton University in 2019 entering different […]
6. Employment sectors of graduates The chart below shows the proportions of graduates from Brighton University in 2019 entering different […]
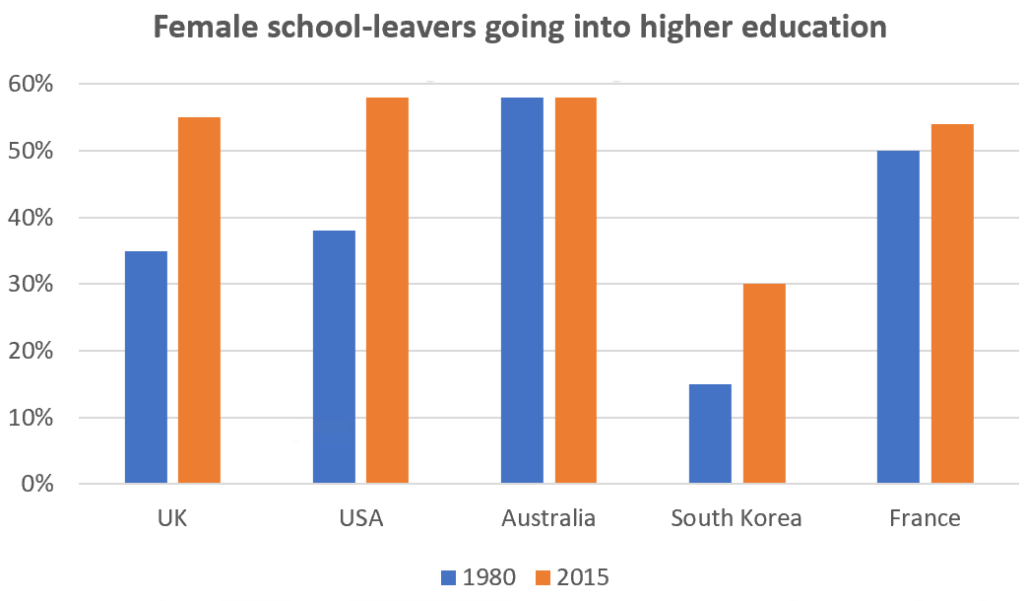
9. IELTS Writing task 1. Percentage of women going into higher education. The chart gives information on the percentage of
Model answer by Lifestyle Training Centre The maps illustrate the layout of Grange Park in 1920 compared to its present-day
Question: 7 Model answer by Lifestyle Training Centre The given process diagram outlines the detailed and multifaceted stages that are
Question no: 8 The graph gives information about the age of the population of Iceland between 1990 and 2020. Summarise
IELTS PROCESS DIAGRAM The diagram below shows how orange juice is produced. Summarise the important information by selecting and reporting
24. IELTS Writing task 1. Female unemployment rates in each country of the United Kingdom The graph below shows female
6. IELTS Writing task 1. Percentages of the Canadian workforce The bar chart shows the percentages of the Canadian workforce
Model answer by Lifestyle Training Centre The provided maps juxtapose the present and past layouts of Paradise Island, highlighting the
Question: 21: The chart below gives information about science qualifications held by people in two countries. Summarise the information by