Question: 29 The chart below shows the percentage of male and female teachers in six different types of educational setting in the UK in 2010. Summarise the information by selecting and reporting the main features, and make comparisons where relevant.
Model answer by Lifestyle Training Centre
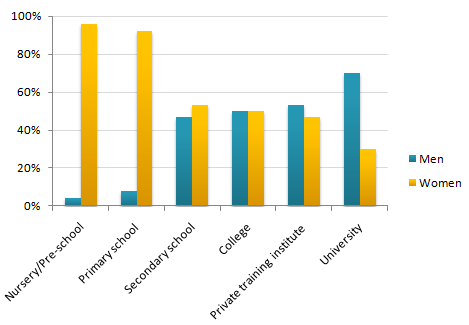
The given bar chart illustrates gender wise percentage distribution of male and female teachers among six various kinds of academic settings in the United Kingdom in the year 2010.
Overall, it is evident that the proportion of men increases noticeably as the academic level rises. Conversely, the percentage of women who are employed in lower academic levels are substantially higher, presenting a stark contrast with men.
In Nursery/Pre-school, around 3% of teachers are male and the remaining 97% females. Likewise, primary school consists of around 7% male tutors and 93% female. In secondary school, around 47 % of teachers are male and the remaining 53% female. Interestingly, at college level, the gender wise distribution of teachers are equal: 50% each.
Private training institute consists of around 53% male and 47% female faculties. At university level, around 70% of the faculties are male, while less than half of the strength, 35%, are female.
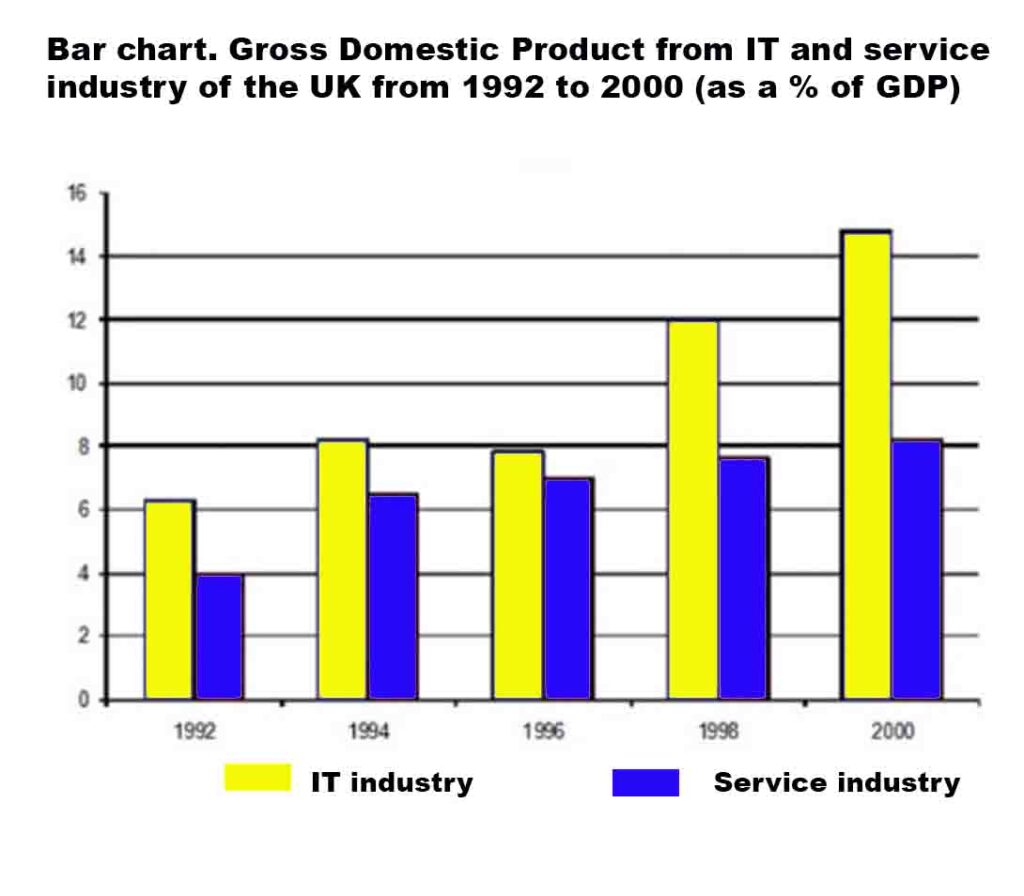
The provided bar chart delineates the Gross Domestic Product (GDP) of the United Kingdom, attributed to the Information Technology (IT) and service industry. The data spans a nine-year period, covering the years 1992 to 2000.
Overall, it is evident that the percentage of GDP witnessed a substantial increase, nearly doubling over the nine-year period for both the Information Technology and Service industries, despite minor fluctuations.
Commencing at slightly above 6% in the year 1992, the IT industry witnessed an upward trajectory, peaking at over 8% in the year 1994. Despite a marginal decline in the year 1996 to just under 8%, the GDP soared, reaching a pinnacle of approximately 15% by the year 2000.
Concurrently, the Service Industry’s GDP, starting at 4 percentage in the year 1992, exhibited a consistent upward trend, culminating in a figure slightly surpassing 8 percentage by the conclusion of the period in the year 2000.
List of vocabulary used:
1. Provided – supplied, given 2. Delineates – describes, outlines 3. Gross Domestic Product (GDP) – national income, economic output 4. Attributed – related, linked 5. Information Technology (IT) – computing, tech industry 6. Service industry – service sector, tertiary sector 7. Data – information, statistics 8. Spans – covers, extends over 9. Period – timeframe, duration 10. Overall – generally, in summary
21. Peaking – reaching the highest point, hitting a maximum 22. Marginal – slight, minor 23. Decline – decrease, drop 24. Soared – skyrocketed, surged 25. Pinnacle – peak, summit 26. Approximately – about, nearly 27. Concurrently – at the same time, simultaneously
We hope this information has been valuable to you. If so, please consider a monetary donation to Lifestyle Training Centre via UPI. Your support is greatly appreciated.
Would you like to undergo training for OET, PTE, IELTS, Duolingo, Phonetics, or Spoken English with us? Kindly contact us now!