The tables below give information about the world population and distribution in 1950 and 2000, with an estimate of the situation in 2050. Summarise the information by selecting and reporting the main features, and make comparisons where relevant.
Model answer by Lifestyle Training Centre:
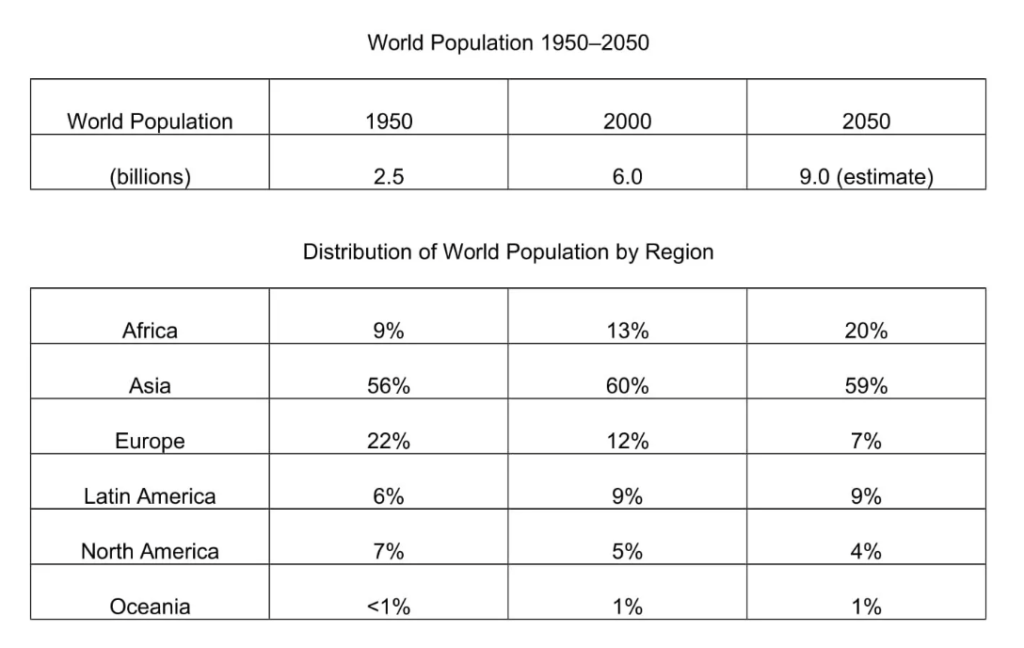
The tables offer insights into the global population in billions and its regional distribution as a percentage in 1950 and 2000, along with projections for 2050.
In broad terms, it is evident that the world population is on an upward trajectory. While the predicted percentage increases for Africa, it either declines or stabilises for the remaining regions.
In 1950, the world’s population was just 2.5 billion, which underwent a slightly above twofold change, reaching 6 billion by 2000 and is estimated to climb further to 9 billion by 2050. In 1950, Asian population consisted of 56% of the overall figures, which grew to 60% by 2000 and is expected to be at 59% by 2050. Africa showed a notable growth in percentage of population, 9% in 1950 to 13% in 2000, expecting to reach 20% by 2050. Latin America, and Oceania increased their percentage of population. The former from 6% in 1950 to 9% in 2000 and the latter from less than 1% in 1950 to 1% in 2000. Both these figures are expected to remain the same in 2050.
On contrary, the percentage-wise distribution of Europe and North America plummeted notably and is expected to go even lower by 2050, Europe to 7 and North America 4 %. In terms of percentage, Europe covered 22% of world’s population in 1950, which drastically slumped to 12% by year 2000. North America, likewise, diminished her percentage to 5% in 2000 from 7% in 1950.
List of vocabulary used:
- Insights: Understanding gained from analysis.
- Distribution: The way something is spread out among a group.
- Projections: Estimates or forecasts based on current data.
- Evident: Clearly seen or understood; obvious.
- Trajectory: The path or progression of something over time.
- Declines: Decreases in quantity, quality, or importance.
- Stabilises: Maintains a steady state; makes stable.
- Underwent: Experienced or was subjected to something.
- Twofold: Consisting of two parts or aspects; doubled.
- Notable: Worthy of attention; remarkable.
- Diminished: Made smaller or less; decreased.
- Plummeted: Fell or dropped suddenly and steeply.
- Drastically: In a way that is severe or serious.
- Slumped: Fell or dropped heavily or suddenly.
- Expecting: Anticipating or looking forward to something.
- Marginal: Relating to a small amount or degree.
- Overall: Taking everything into account; general.
- Figures: Numerical data or statistics.
- Percentage: A fraction or ratio expressed as a part of 100.
- Growth: An increase in size, number, or value.
IELTS Speaking Task Topics
Click on any topic to explore more!
Names

Learn about the importance of names and their cultural significance.
Study / Job

Discuss various aspects of studying and working in different fields.
Hometown

Explore the charm of your hometown and its unique features.
Accomodation

Understand various types of accommodation and living situations.
Weather

Learn about how weather influences daily life and activities.
Time

Discuss the concept of time, its importance, and time management.
Television

Talk about the role of television in modern entertainment.
Museum

Discuss the cultural importance of museums and historical exhibits.
Holidays

Explore the significance of holidays and different celebrations.
Films

Learn about the impact of films on culture and society.
Leisure Time

Discuss how leisure activities impact personal well-being.
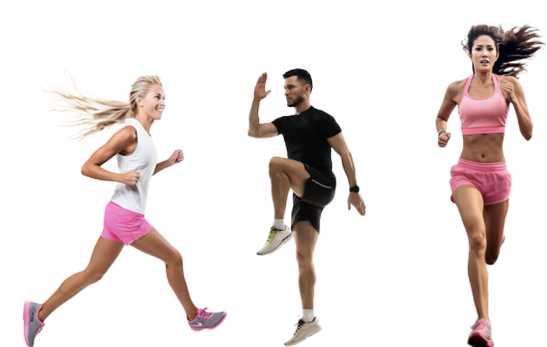
Sport

Talk about the role of sports in health, entertainment, and culture.
Vegetables and Fruits
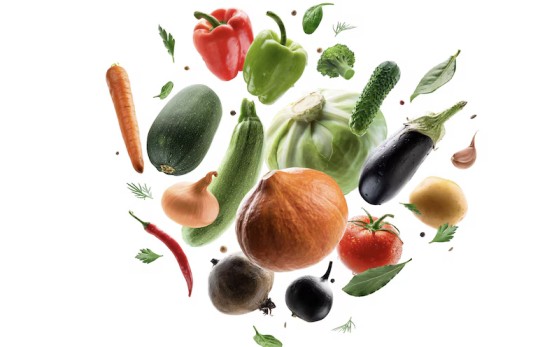
Discuss the health benefits and importance of fresh produce.
Maths

Explore the role of mathematics in various aspects of life.
Sky

Discuss the beauty and scientific significance of the sky.
Clothes&Fashion

Explore how clothing reflects culture and personal expression.
Weekend

Discuss the importance of weekends and ways people relax.
Reading

Learn about the importance of reading and various reading habits.
Sleep

Explore how sleep impacts physical and mental well-being.
Trees&Plants

Discuss the environmental and health benefits of plants.
Newspaper

Discuss the evolving role of newspapers in the digital age.
Texting

Explore the role of text messaging in modern communication.
Memorising

Learn techniques for improving memory and memorization.
Travelling

Discuss the importance and impact of traveling in modern society.
Communication

Explore the modes and significance of communicating well
Letter&Email

Explore the differences and significance of letters vs. emails.
Swimming

Discuss the benefits of swimming for health and fitness.
Snacks

Explore the role of snacks in daily nutrition and lifestyle.
Photography

Discuss photography’s cultural and artistic significance.
Help

Talk about the importance of offering and receiving help.
History

Discuss historical events and their impact on modern society.
Handwriting

Explore the significance of handwriting in education and culture.
Music

Learn about the influence of music on emotions and society.
Colours

Discuss how colours affect perception and mood.
Teachers

Explore the role of teachers in shaping students’ futures.
Being Alone

Talk about the experience and benefits of spending time alone.
Teamwork

Learn the importance of teamwork in professional and social contexts.
Countryside & City

Explore the charm and benefits of living in the countryside.
Social Media

Discuss the impact of social media on society and relationships.
Friends

Explore the importance of friendships in life.
Artificial Intelligence (AI)

Talk about the future of AI and its role in society.
Climate Change

Discuss the causes and consequences of climate change.
Transportation
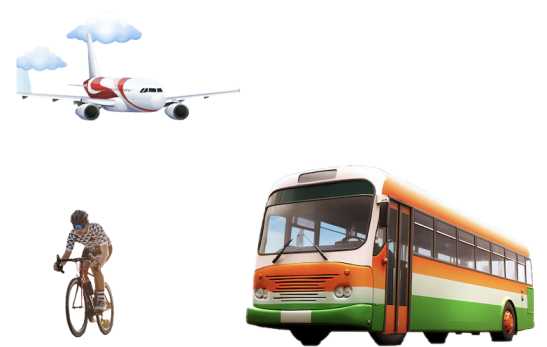
Explore different modes of transportation in your area.
Sustainable Transportation
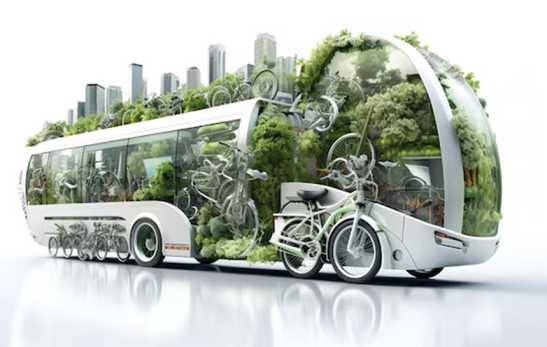
Explore ways to make transportation more environmentally friendly.
Space Exploration

Learn about the latest advancements in space exploration.
Shopping

Explore how shopping influences culture and the economy.
Modern Technology

Discuss how modern technology is reshaping society.
Technology

Learn about the role of technology in everyday life.
Sustainable Living

Explore ways to live sustainably for the future of the planet.
Globalisation

Learn about the effects of globalisation on society and economies.
Global Warming

Discuss the causes, effects, and solutions to global warming.
Gender Equality

Explore the importance of gender equality in modern society.
Health and Fitness
Discuss the importance of maintaining a healthy lifestyle.
Renewable Energy

Learn about renewable energy sources and their impact on the environment.
Cultural Traditions in Kerala
Explore the unique cultural traditions of Kerala, your hometown.
Cultural Traditions in Your Country

Learn about the cultural traditions in your country.
Education System
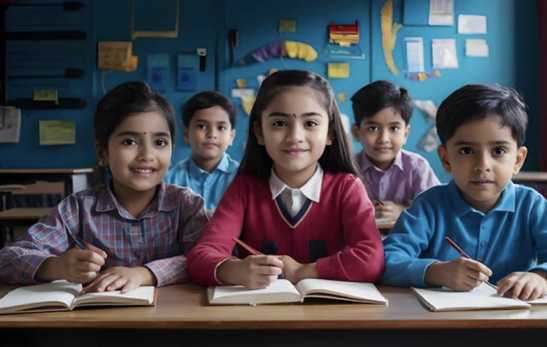
Discuss the education system in your country and its effectiveness.
Traditional Cuisine
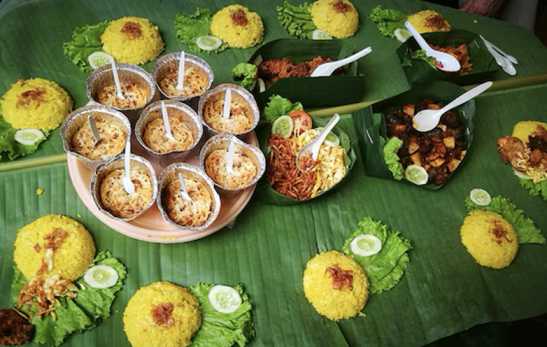
Explore the significance of traditional cuisines in your culture.
Do you need printed IELTS/ OET practice material? Place your order today. Available now for just Rs: 1,100 (including shipping all across India) Contact us at our WhatsApp number: +91 9886926773 to place your order. (Free for LTC students)
We hope this information has been valuable to you. If so, please consider a monetary donation to Lifestyle Training Centre via UPI. Your support is greatly appreciated.
Would you like to undergo training for OET, PTE, IELTS, Duolingo, Phonetics, or Spoken English with us? Kindly contact us now!
📱 Call/WhatsApp/Text: +91 9886926773
📧 Email: mail@goltc.in
Visit us in person by following the directions on Google Maps. We look forward to welcoming you to the Lifestyle Training Centre.
Follow Lifestyle Training Centre on social media:
Thank you very much!
Free admission and English Courses. കാശ് കൊടുക്കാതെ അഡ്മിഷൻ. FREE ഇഗ്ലീഷ് കോഴ്സുകൾ. ഈ ഓഫർ നേടൂ. Contact us at +91 9886926773 പ്രോസസ്സിംഗ് ആയാസകരം.
New batch is open. Join today!

Ready to study abroad or master OET, PTE, IELTS, Duolingo, Phonetics, or Spoken English?
📞 Call us now at +91 9886926773
📱 Call/WhatsApp/Text: +91 9886926773
📧 Email: mail@goltc.in
Visit us in person by following the directions on Google Maps. We look forward to welcoming you to the Lifestyle Training Centre.
Follow Lifestyle Training Centre on social media:
Thank you very much!
Pingback: Table IELTS writing task 1 Academic | Lifestyle Training Centre®