Sample answer by Lifestyle Training Centre
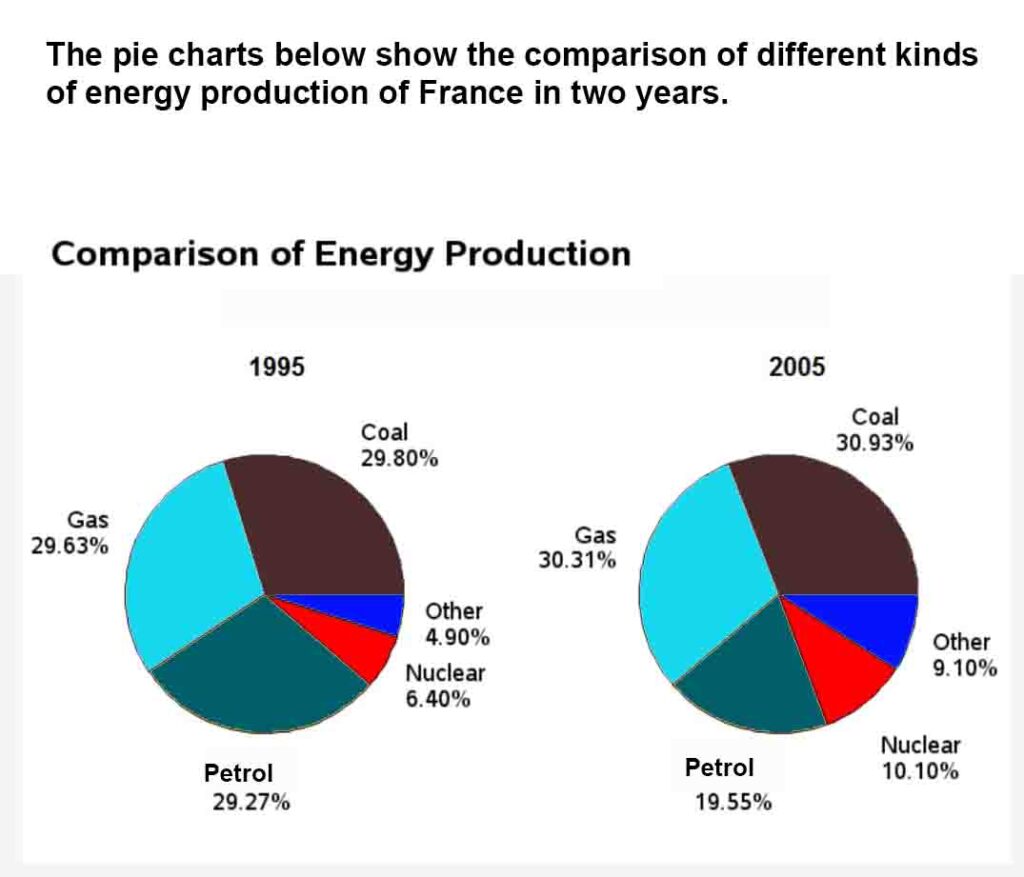
The presented pie charts compare the distribution of energy production percentages in France for the years 1995 and 2005 across five sources: Coal, Gas, Petrol, Nuclear, and Other.
Overall, Petrol, Gas, and Coal emerged as the dominant contributors to energy production, while Nuclear and Other sources played a minor role. Interestingly, this percentage distribution exhibited a remarkable degree of consistency in both 1995 and 2005.
The percentage of Coal production showed stability, maintaining close values of 29.80% in 1995 and 30.93% in 2005. Similarly, Gas production witnessed a marginal increase from 29.63% in 1995 to 30.31% in 2005. However, the percentage of the contribution of Petrol, despite being 29.27% in 1995, significantly decreased to 19.55% in 2005.
In contrast, Nuclear energy production nearly doubled, surging from 6.40% in 1995 to 10.10% in 2005. Additionally, the proportion from Other sources experienced a notable rise from 4.90% in 1995 to 9.10% in 2005.
Free admission and English Courses. കാശ് കൊടുക്കാതെ അഡ്മിഷൻ. FREE ഇഗ്ലീഷ് കോഴ്സുകൾ. ഈ ഓഫർ നേടൂ. Contact us at +91 9886926773 പ്രോസസ്സിംഗ് ആയാസകരം.

New batch is open. Join today!

Ready to study abroad or master OET, PTE, IELTS, Duolingo, Phonetics, or Spoken English?
📞 Call us now at +91 9886926773
📱 Call/WhatsApp/Text: +91 9886926773
📧 Email: mail@goltc.in
Visit us in person by following the directions on Google Maps. We look forward to welcoming you to the Lifestyle Training Centre.
Follow Lifestyle Training Centre on social media:
Thank you very much!