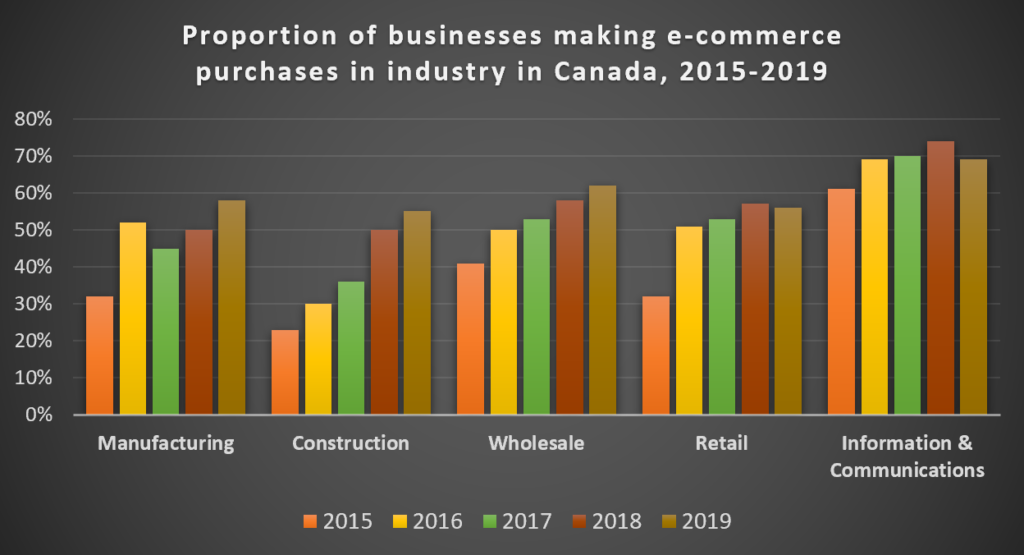
The chart below shows the proportion of businesses making e-commerce purchases by industry in Canada between 2015 and 2019. Summarise the information by selecting and reporting the main features, and make comparisons where relevant.

Sample answer by Lifestyle Training Centre
The provided bar chart meticulously outlines the percentage of businesses in Canada that are engaged in online trade in manufacturing, construction, wholesale, retail, and information and communication industries over a span of five years, from 2015 to 2019.
Overall, it is evident that the proportion of online purchases shows an upward trajectory throughout the given periods, with marginal increase and minor fluctuations, while the highest proportion of transactions are made by information and communications industry.
While the proportion of online purchases in the construction industry in 2015 amounted to almost a quarter, it steadily climbed, more than doubling to around 55% by 2019. Wholesale industry, likewise, grew from around 40% in 2015 to above 60% by year 2019. Although the manufacturing industry expanded its e-commerce presence from around 30% in 2015 to surpassing 50% by 2016, it faced a decline in 2017 to approximately 45%. Subsequently, it rebounded, reaching around 60% in 2019.
Concurrently, e-commerce in case of the retail and information and communications, the former increased from approximately 32% in 2015 to nearly 57% by 2018, while the latter rose from around 60% in 2015 to about 75% by 2018. However, both industries experienced a marginal decline in 2019, with the retail industry dropping to around 55%, and the information and communications industry decreasing to around 70%.
(word count -218)
