The graph below gives information about changes in the birth and death rates in New Zealand between 1901 and 2101. Summarise the information by selecting and reporting the main features, and make comparisons where relevant.
Model answer by Lifestyle Training Centre
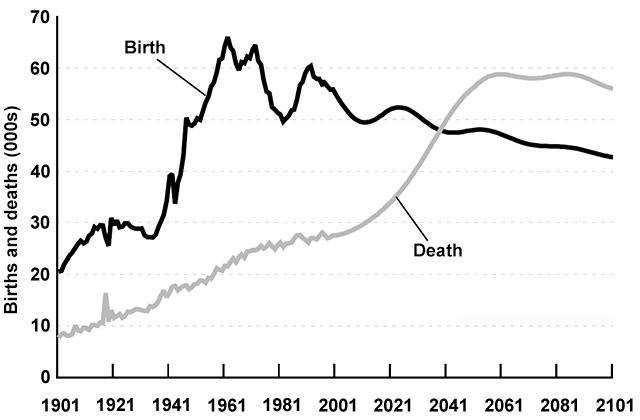
The provided line graph delineates the fluctuations in New Zealand’s mortality and childbirth rates from 1901 to 2101, with figures presented in thousands.
Overall, it is evident that the mortality rate exhibits a consistent upward trend over the given time frame, while the birth rate displays significant fluctuations, including a decline after the midpoint.
In 1901, the mortality rate stood at approximately 8,000 deaths in New Zealand. This figure steadily increased with minor annual fluctuations, reaching around 28,000 deaths by 2001. Subsequently, a sharp rise is predicted, nearly doubling to almost 59,000 by 2061. Despite this surge, stability is anticipated until 2081, followed by a slight decrease to almost 56,000 by 2101.
Conversely, birth rates in 1901 were approximately 20,000, rising to nearly 30,000 in 1921 amidst notable fluctuations. The figures peaked at around 65,000 in 1961 before experiencing substantial fluctuations, ultimately declining to around 50,000 by 1981. By midway through 2001, a rebound to around 60,000 occurred. However, a subsequent decline is observed, with fluctuations, leading to an estimated figure of only around 43,000 by 2101.