Sample answer by Lifestyle Training Centre
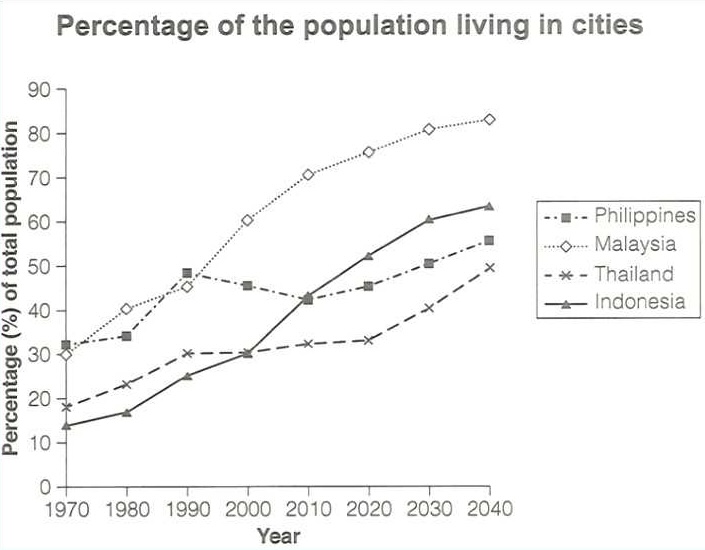
The provided line graph denotes the percentage of the total number of people living in four different cities, namely: Philippines, Malaysia, Thailand, and Indonesia from the year 1970 to 2040.
Overall, it is observed that the population trend projects an upward trajectory for all the cities throughout the given period. While Malaysia culminates at the top in terms of numbers, Thailand has the lowest population.
Despite initially having the lowest population percentage (less than 15%) among the cities in 1970, Indonesia demonstrates a remarkable upward trend, culminating at around 65% by 2040. Similarly, Malaysia exhibits a parallel trend, starting at 30% in 1970 and reaching approximately 85% by 2040.
Philippines, unlike the other three given cities, experiences drastic fluctuations in population. Starting just above 30% in the year 1970, it undergoes sharp population growth, reaching close to 50%. However, from 1990 to 2010, it plummets to around 43%. Subsequently, the percentage recovers and rises, reaching almost 55% by 2040.
(words used: 159)