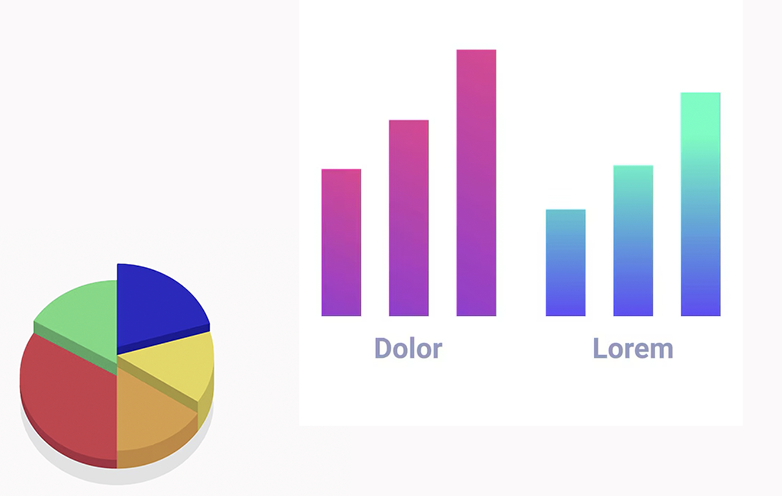
In an IELTS task featuring a bar chart and a line diagram, candidates must analyze and present data from both visuals. This entails summarizing main trends, making comparisons, and noting significant details. The ability to convey information concisely and accurately is crucial for a successful response.
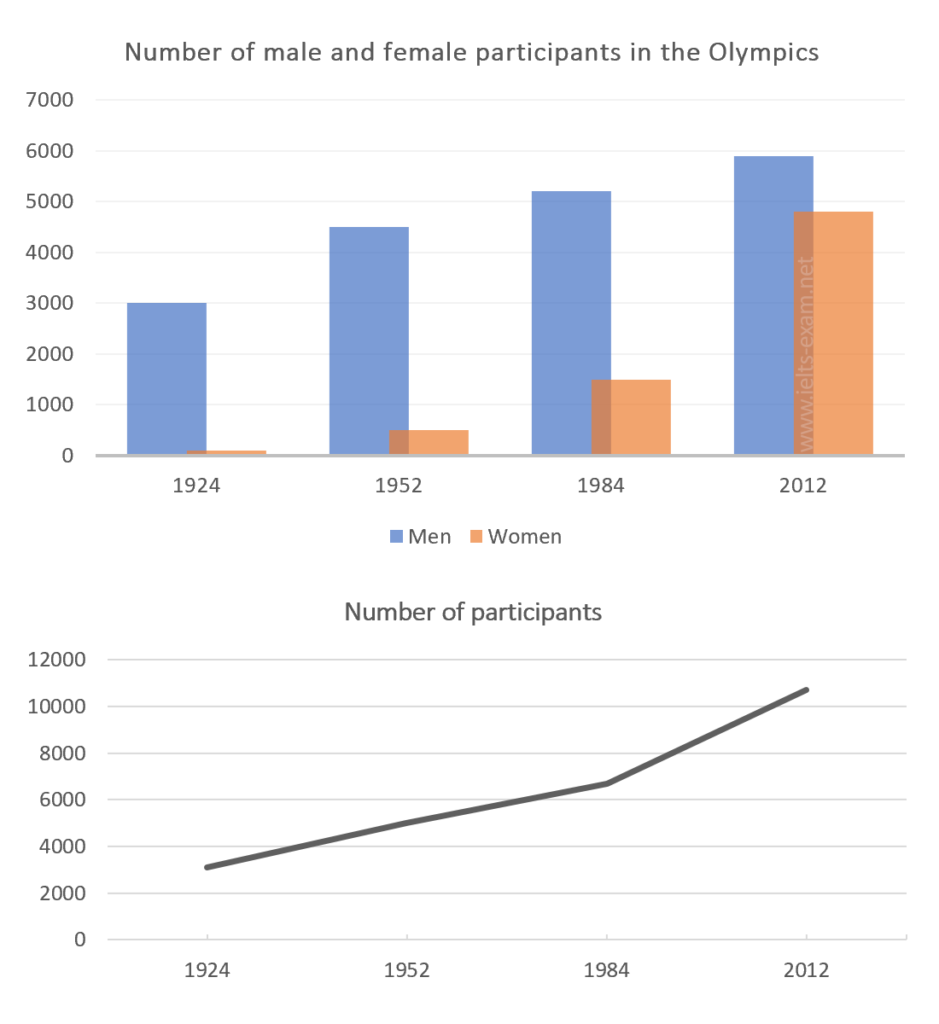
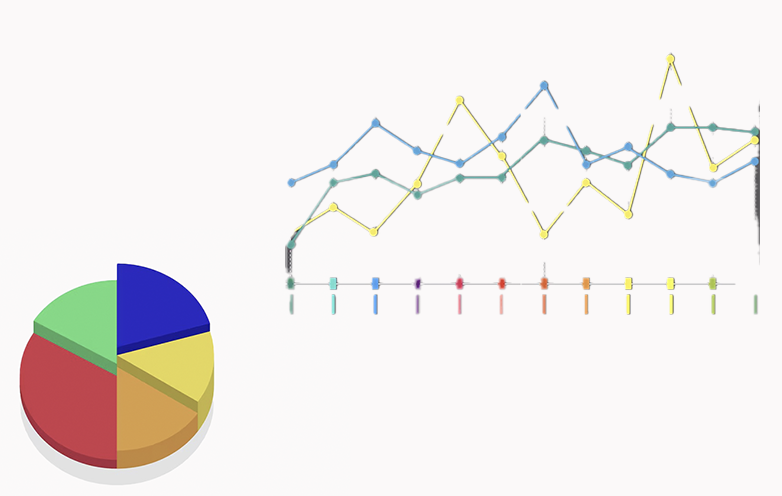
1. IELTS Bar chart + Line diagram: Participants who have entered the Olympics:
The chart and graph below give information about participants who have entered the Olympics since it began. Summarise the information by selecting and reporting the main features, and make comparisons where relevant.
IELTS Academic Writing Task 1 Types
Explore and prepare for different chart types used in IELTS Task 1
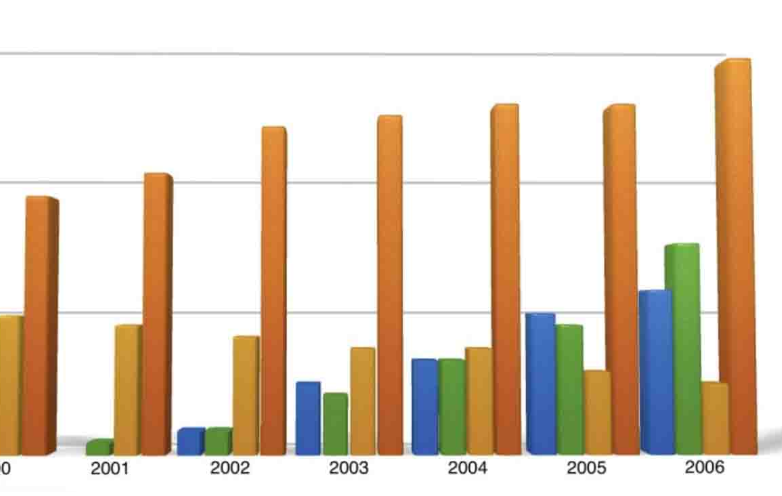
IELTS Bar Charts
Understand how to interpret and describe bar charts in task 1.

IELTS Pie Charts
Learn the techniques for describing pie charts in detail.
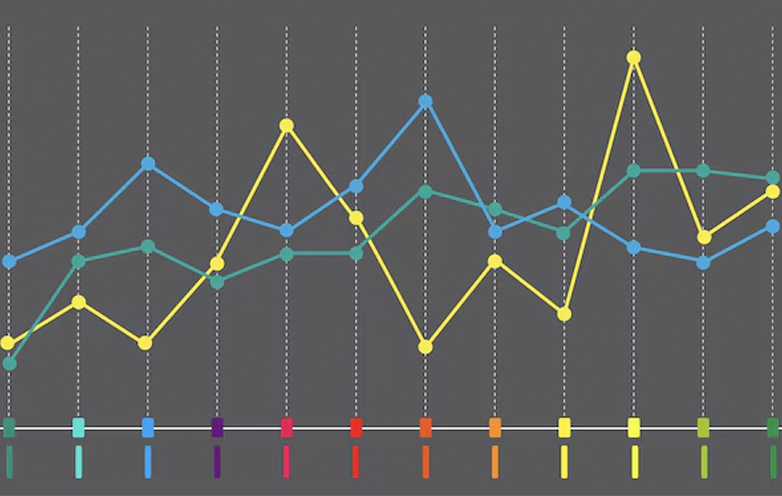
IELTS Line Graph
Get tips on how to describe trends using line graphs.
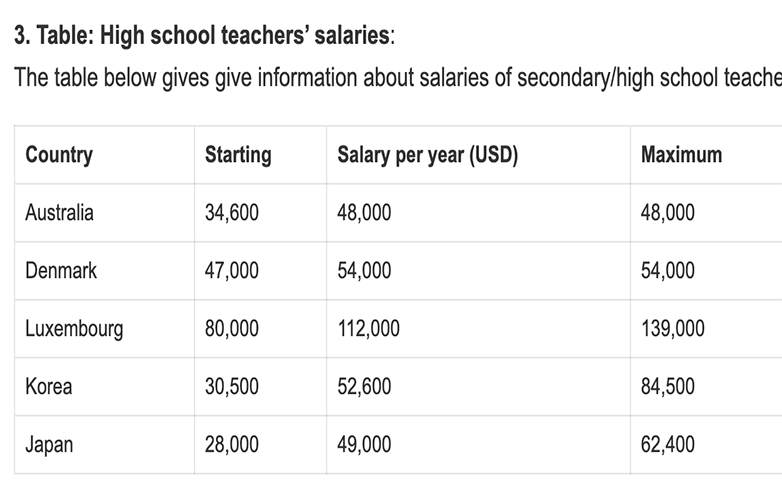
IELTS Table
Master the skills to describe tables in academic writing.
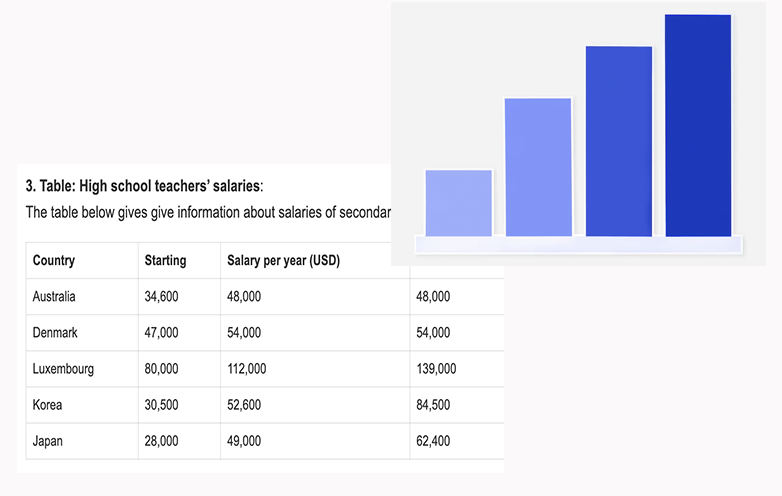
IELTS Bar Chart + Table
Learn how to combine bar charts with tables in task 1 responses.
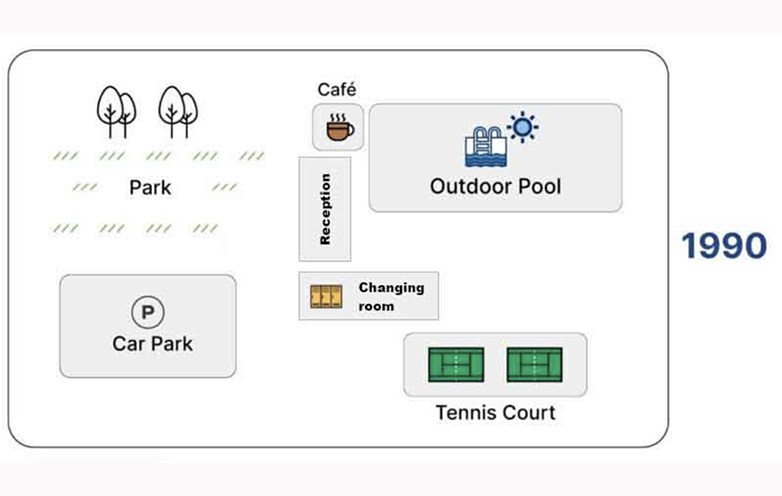
IELTS Maps
Explore how to describe maps and geographical changes.
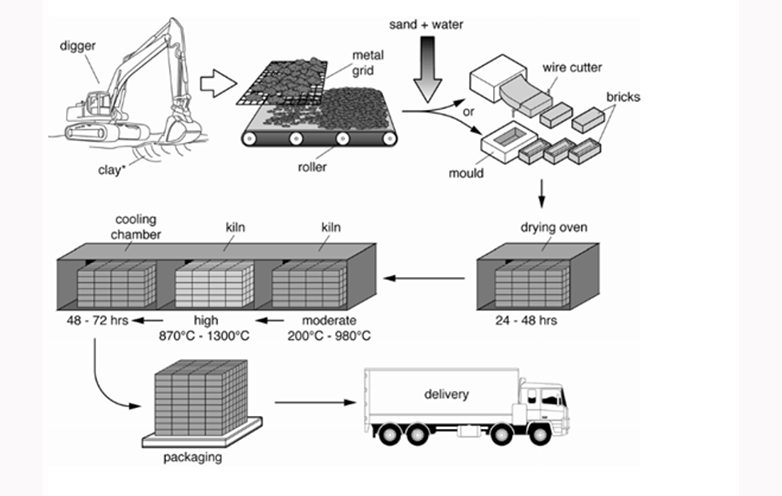
IELTS Process Diagram
Understand how to write about process diagrams step by step.
IELTS Bar Chart + Line Graph
Learn how to integrate bar charts with line graphs.
IELTS Bar Chart + Pie Chart
Master combining bar charts with pie charts in task 1.
Do you need printed IELTS/ OET practice material? Place your order today. Available now for just Rs: 1,100 (including shipping all across India) Contact us at our WhatsApp number: +91 9886926773 to place your order. (Free for LTC students)
We hope this information has been valuable to you. If so, please consider a monetary donation to Lifestyle Training Centre via UPI. Your support is greatly appreciated.

Would you like to undergo training for OET, PTE, IELTS, Duolingo, Phonetics, or Spoken English with us? Kindly contact us now!
📱 Call/WhatsApp/Text: +91 9886926773
📧 Email: mail@goltc.in
Visit us in person by following the directions on Google Maps. We look forward to welcoming you to the Lifestyle Training Centre.
Follow Lifestyle Training Centre on social media:
Thank you very much!