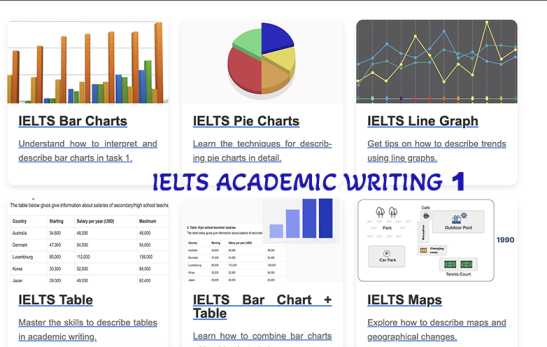
IELTS Academic Writing Task 1 Types
Explore and prepare for different chart types used in IELTS Task 1
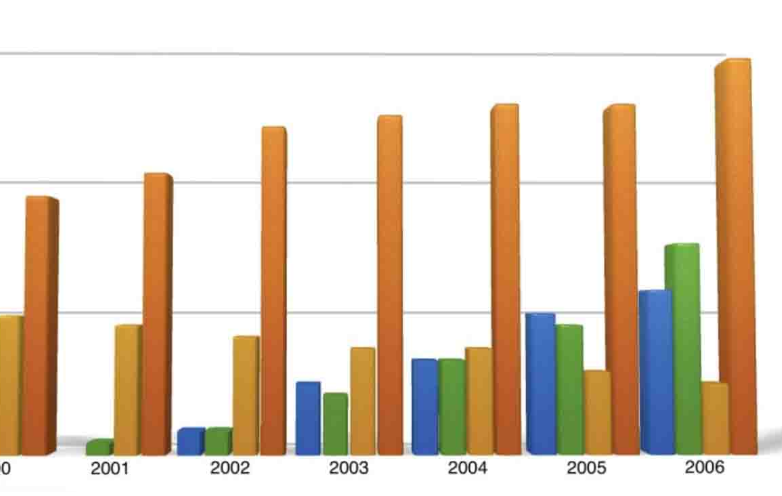
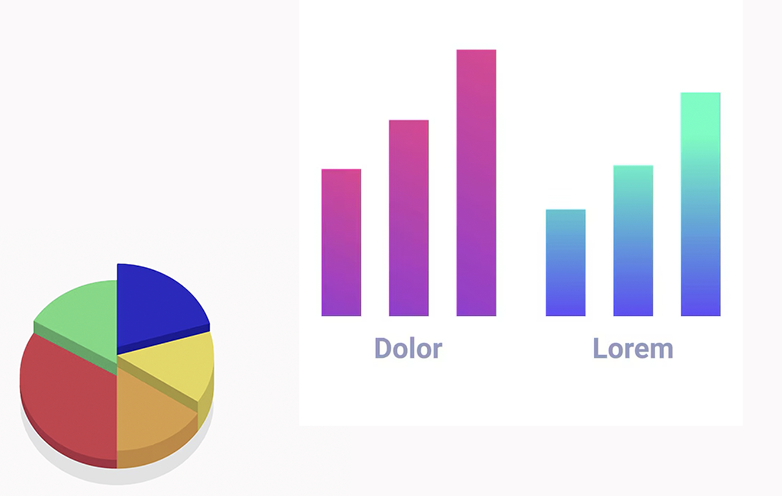
IELTS Bar Charts
Understand how to interpret and describe bar charts in task 1.
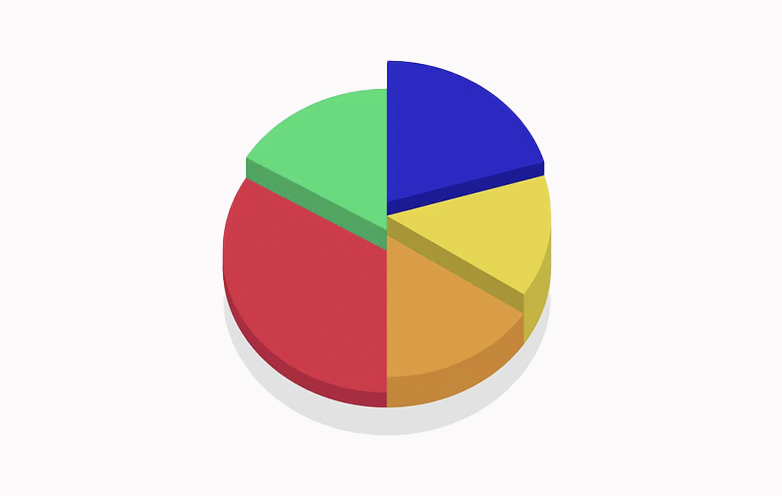
IELTS Pie Charts
Learn the techniques for describing pie charts in detail.
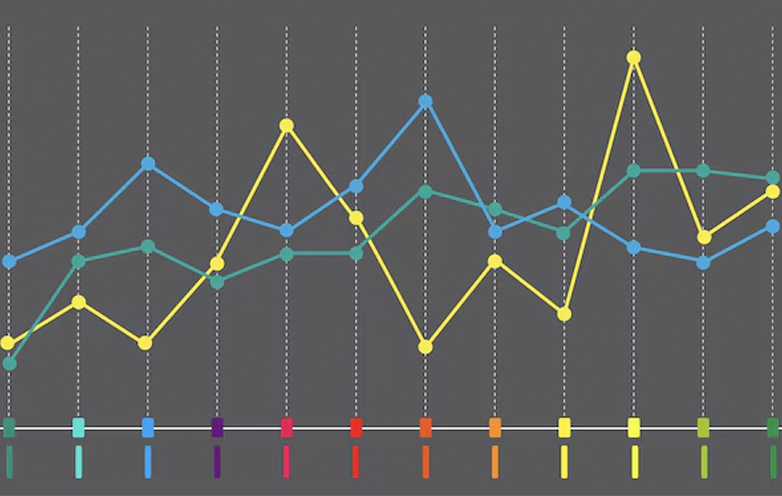
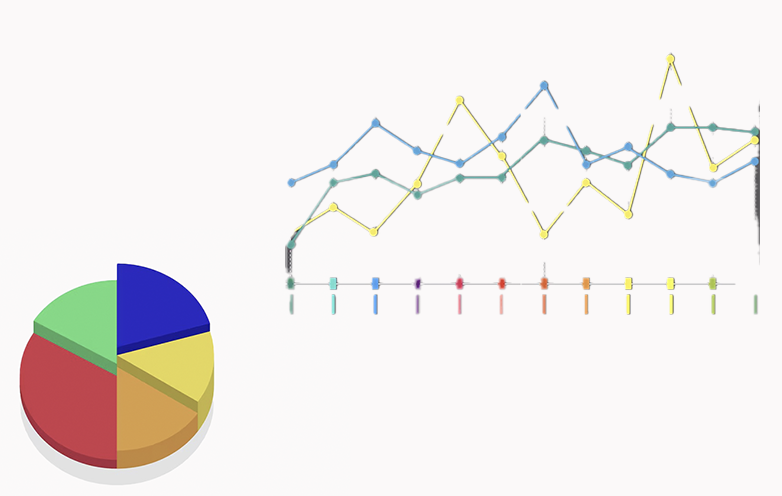
IELTS Line Graph
Get tips on how to describe trends using line graphs.
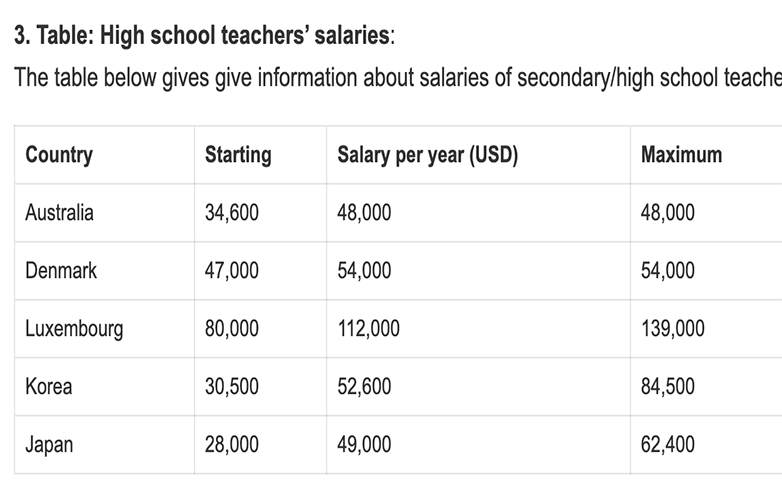
IELTS Table
Master the skills to describe tables in academic writing.
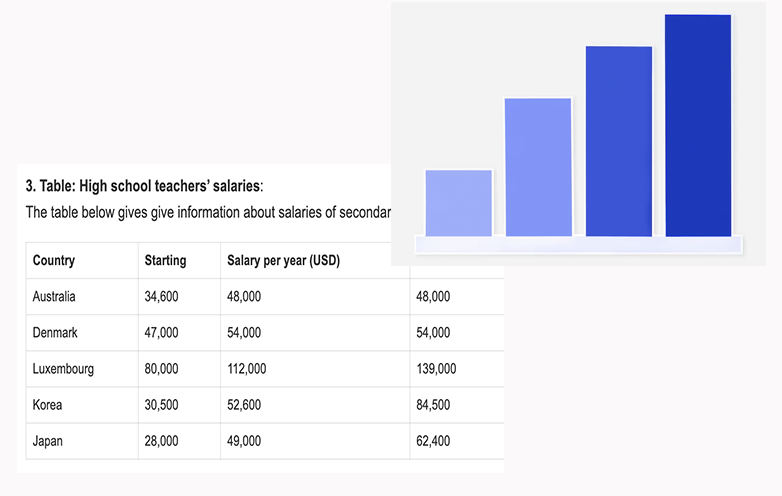
IELTS Bar Chart + Table
Learn how to combine bar charts with tables in task 1 responses.
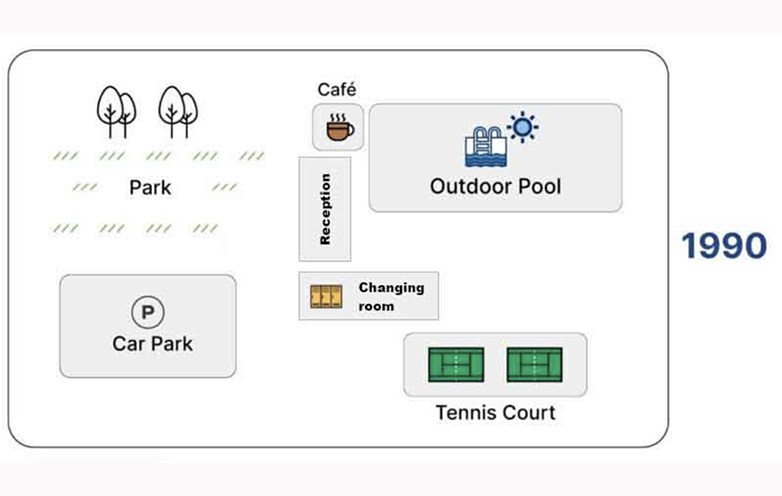
IELTS Maps
Explore how to describe maps and geographical changes.
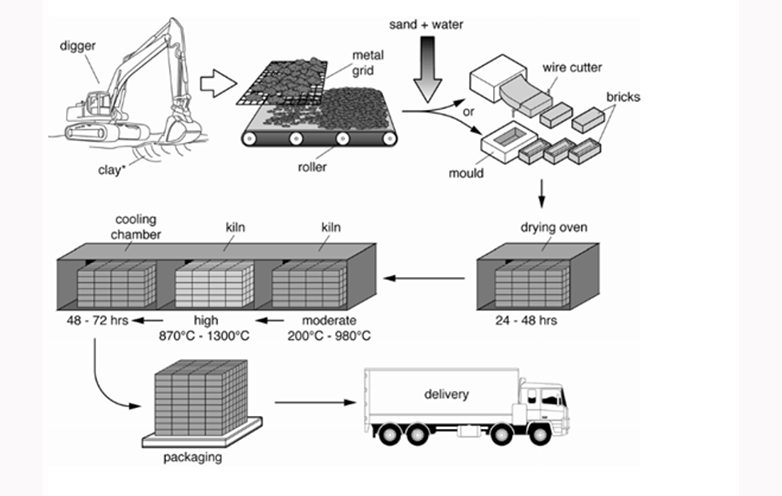
IELTS Process Diagram
Understand how to write about process diagrams step by step.
IELTS Bar Chart + Line Graph
Learn how to integrate bar charts with line graphs.
IELTS Bar Chart + Pie Chart
Master combining bar charts with pie charts in task 1.
Welcome to our comprehensive guide for IELTS Academic Writing Task 1. Whether you are preparing for the IELTS exam or seeking to enhance your writing skills, our website is your go-to resource for valuable insights, tips, and practice materials.
In Task 1, you’ll be presented with a visual representation of information, such as a graph, chart, table, or diagram, or combination of these. Navigating this task effectively requires a solid understanding of key strategies and structures.
IELTS writing task 1 vocabulary

Explore our tutorials, sample responses, and expert guidance to elevate your Task 1 performance.
TIPS
- Time Management: Spend around 20 minutes on Task 1 and 40 for task 2, but remember, it’s your clock to command.
- Word Count: You must use at least 150 words for writing task 1.
- Weight in Marks: Task 1 contributes about 33% to your total writing score.
- Marking Criteria:
- Task Achievement (25%)
- Coherence & Cohesion (25%)
- Vocabulary (25%)
- Grammar (25%)
- Band Score Mastery: Dive into our IELTS BAND SCORE CALCULATOR page for expert tips and insights on achieving your desired band score.
- Task Types: For Academic Writing Task 1, expect a report on various visuals (bar chart, line graph, pie chart, table, map, or diagram/process). Explore practice charts, model answers, and invaluable tips.
- Word Count Rules: Every word matters. Write around 170 words for safety.
- Go through IELTS rules, tips, and frequently asked questions provided on this website for a smoother testing experience.
How to write task 1? Write just 4 paragraphs, for task 1.
1. Introduction paragraph. (1st paragraph)
2. Overview paragraph (2nd paragraph)
3. Body paragraph 1 (3rd paragraph)
4. Body paragraph 2. (4th paragraph)
- Introduction paragraph: This paragraph is the easiest and most important one. Just paraphrase the question without changing its meaning. Use synonyms and various tenses to manipulate the sentence to a different one with same meaning.
Example: Question: Bar chart. Gross Domestic Product from IT and service industry of the UK from 1992 to 2000 (as a % of GDP)
Answer: The presented pie charts compare the distribution of energy production percentages in France for the years 1995 and 2005 across five sources: Coal, Gas, Petro, Nuclear, and Other.
Notice that the meaning remains the same even though we paraphrased the text.
Do not copy the text from the question. Write in your own words.
Do not add any data in the 1st and 2nd paragraphs.
Do not give detailed explanation.
2. Overview paragraph (second paragraph)
This paragraph is quite easy too. You just need to look at the task and understand the trend.
Is it overall increase? It is remaining same? Some are increasing and others are decreasing?
Example: Overall, there are 4 stages, starting with the collection or raw materials and ending with the distribution of final product.
Example: Overall, Petrol, Gas, and Coal emerged as the dominant contributors to energy production, while Nuclear and Other sources played a minor role. Interestingly, this percentage distribution exhibited a remarkable degree of consistency in both 1995 and 2005.
Suggested vocabulary to start 2nd paragraph:
| Generally | Overall | In general | On the whole |
| In summary | By and large | Generally speaking | All in all |
| In a nutshell | Broadly speaking | In the grand scheme | Altogether |
| Collectively | Universally | Encompassing | Summarily |
| In essence | Fundamentally | In the aggregate |
Do not add data or details in this paragraph. You will only add data in the body paragraphs (3rd and 4th)
2. Body paragraph (3rd paragraph)
Enter corresponding data here. If you have 4 items, you may enter two here and the other two in the 4th paragraph. Make sure to use correct information. If the percentage in a bard chart is around 40 percentage, you must write “it is around 40 %” and not “40%”. Propositions have to be carefully used here. (Example: increased to, increased by, it is around, it is at 40%). Use proper synonyms for increase, decrease, constant and so on. Familiarise yourself with adverbs and adjectives which can be used for task 1.
Example:
The price increased gradually. There was a steady increase in the price. The price witnessed a progressive rise. There was a systematic and sustained increase in the price…
The price decreased gradually. There was a steady decrease in the price. The price witnessed a progressive decline. There was a systematic and sustained decrease in the price…
4. Body paragraph (4th paragraph)
Like the 3rd body paragraph, give data and finish the report. Both the body paragraphs should be wrote with adequate and accurate supporting data.
Remember, you must not write a conclusion for writing task 1.
Do you need printed IELTS/ OET practice material? Place your order today. Available now for just Rs: 1,100 (including shipping all across India) Contact us at our WhatsApp number: +91 9886926773 to place your order. (Free for LTC students)
We hope this information has been valuable to you. If so, please consider a monetary donation to Lifestyle Training Centre via UPI. Your support is greatly appreciated.

Would you like to undergo training for OET, PTE, IELTS, Duolingo, Phonetics, or Spoken English with us? Kindly contact us now!
📱 Call/WhatsApp/Text: +91 9886926773
📧 Email: mail@goltc.in
Visit us in person by following the directions on Google Maps. We look forward to welcoming you to the Lifestyle Training Centre.
Follow Lifestyle Training Centre on social media:
Thank you very much!