The line graph below shows the consumption of 4 kinds of meat in a European country from 1979 to 2004.
Sample answer by Lifestyle Training Centre:
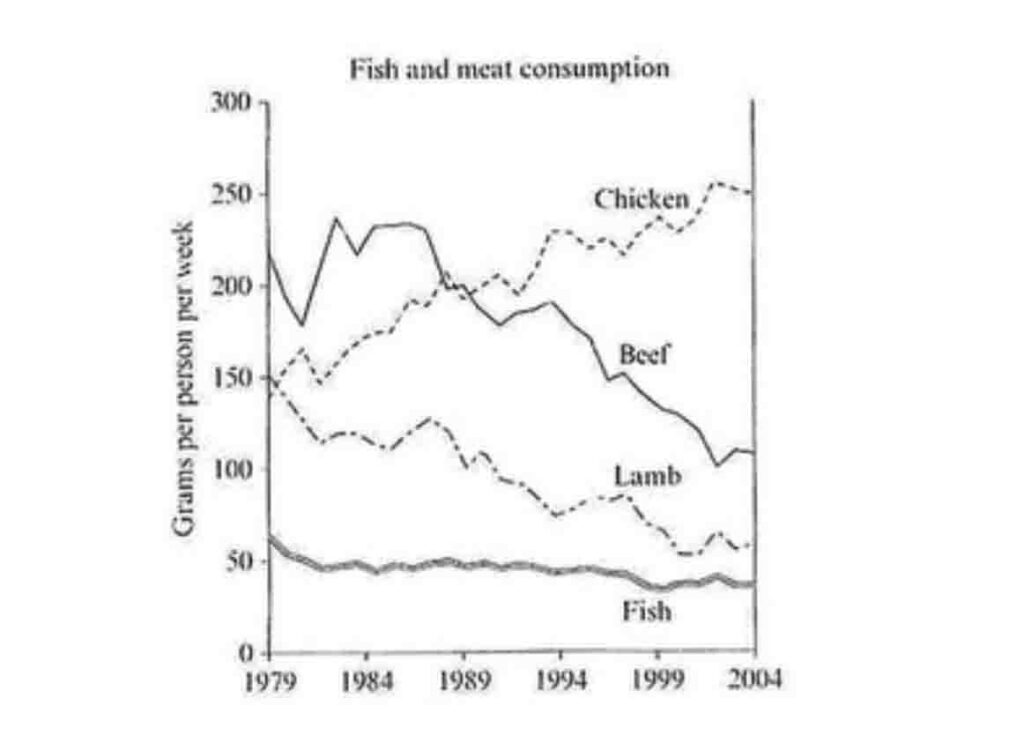
The provided line graph illustrates the weekly consumption, in grams, of chicken, beef, lamb, and fish by individuals in a European country over the period spanning from 1979 to 2004.
In general, it is evident that the consumption of chicken steadily increased over the specified period, whereas the intake of beef and lamb significantly declined. The consumption of fish, on the contrary, remained relatively stable, with a slight dip observed.
In 1979, an individual consumed only 150 grams of chicken. Despite oscillating dramatically, the consumption evidently soared year by year and culminated around 250 grams by the year 2004. The consumption of fish, which was the lowest among all four categories at just above 50 grams per person in 1979, experienced a marginal downturn and lingered just under 50 grams by the year 2004.
The beef intake was approximately 220 grams in the year 1979, reaching a peak of around 240 grams by 1984, although there was a notable plummet to around 180 grams in between. From this point onward, the consumption plunged rapidly, despite sporadic but slight inclines. Lamb, despite being the second most consumed item at 150 grams in 1984, experienced a drastic diminution and reached around 60 grams by the year 2004.