6. Employment sectors of graduates
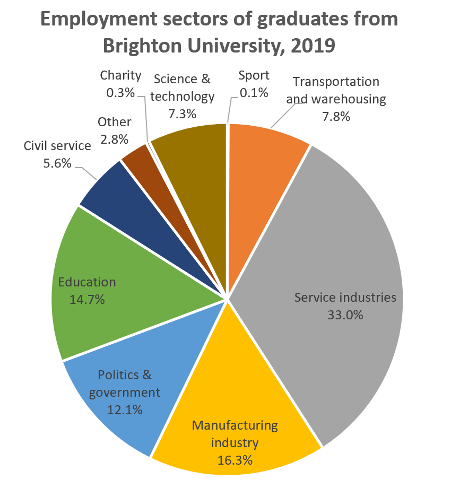
The chart below shows the proportions of graduates from Brighton University in 2019 entering different employment sectors. Summarise the information by selecting and reporting the main features, and make comparisons where relevant.
Model answer by Lifestyle Training Centre
The given pie chart intricately delineates the percentage of students who graduated from Brighton University in 2019 and pursued employment in a variety of professional fields.
Overall, it is evident that the majority of graduates entered the service industries, whereas sectors such as sport, charity, and others attracted the least number of candidates. The chart demonstrates a strong inclination towards mainstream industries, with limited participation in niche sectors.
Delving into specifics, the service industries absorbed the highest share of graduates, accounting for 33 percent. The manufacturing sector followed, providing opportunities for 16.3 percent of students, while education employed 14.7 percent. Additionally, 12.1 percent of Brighton University graduates secured positions in politics and government, indicating a noteworthy interest in civic and administrative roles.
Conversely, the sport sector attracted just 0.1 percent of the graduates, making it the least preferred field. Charity work and other sectors offered employment to 0.3 and 2.8 percent, respectively, while civil services took in 5.6 percent. Furthermore, the science and technology sector accommodated 7.3 percent of the graduates, and transportation and warehousing accounted for 7.8 percent of the total.
List of vocabulary used
| Vocabulary | Short Meaning (UK English) |
|---|---|
| intricately delineates | Describes in detailed and precise manner |
| percentage | A proportion out of 100 |
| pursued | Chose to follow or continue (a career or goal) |
| professional fields | Areas of work or industries |
| evident | Clearly seen or understood |
| service industries | Businesses offering services rather than goods |
| sectors | Distinct parts of the economy or job market |
| mainstream industries | Common or widely chosen fields of work |
| niche sectors | Specialised or narrowly focused industries |
| delving into specifics | Looking closely into detailed aspects |
| absorbed | Took in or accepted (graduates into jobs) |
| accounting for | Representing a portion of the total |
| followed | Came next in sequence or ranking |
| employed | Given a job |
| secured positions | Successfully gained job roles |
| noteworthy | Worth attention; significant |
| civic and administrative roles | Jobs in government or public services |
| conversely | On the other hand; contrastingly |
| least preferred | Chosen by the fewest; not popular |
| accommodated | Provided space, placement, or jobs |
| accounted for | Made up a portion of the whole |
IELTS Academic Writing Task 1 Types
Explore and prepare for different chart types used in IELTS Task 1
IELTS Bar Charts
Understand how to interpret and describe bar charts in task 1.

IELTS Pie Charts
Learn the techniques for describing pie charts in detail.

IELTS Line Graph
Get tips on how to describe trends using line graphs.
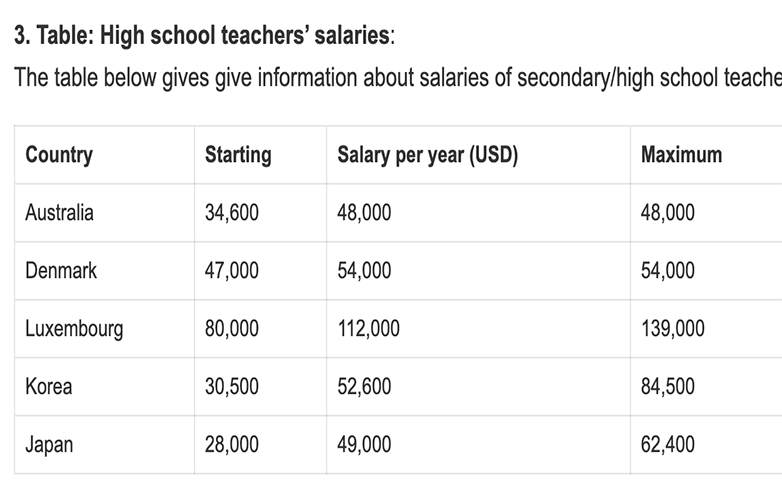
IELTS Table
Master the skills to describe tables in academic writing.
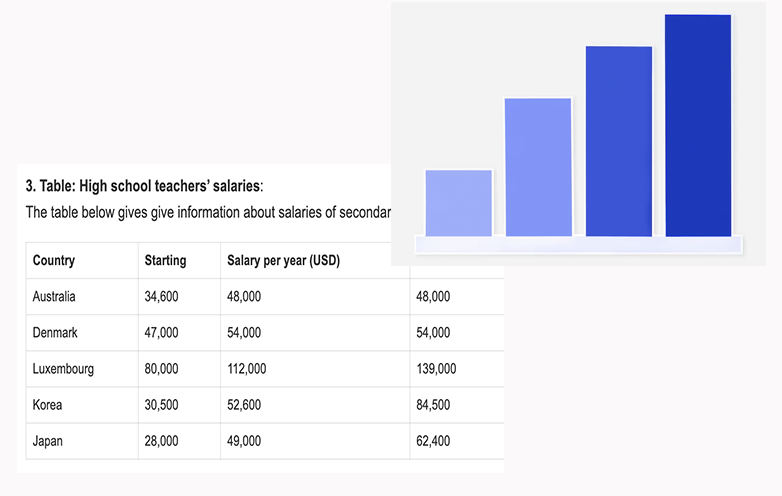
IELTS Bar Chart + Table
Learn how to combine bar charts with tables in task 1 responses.
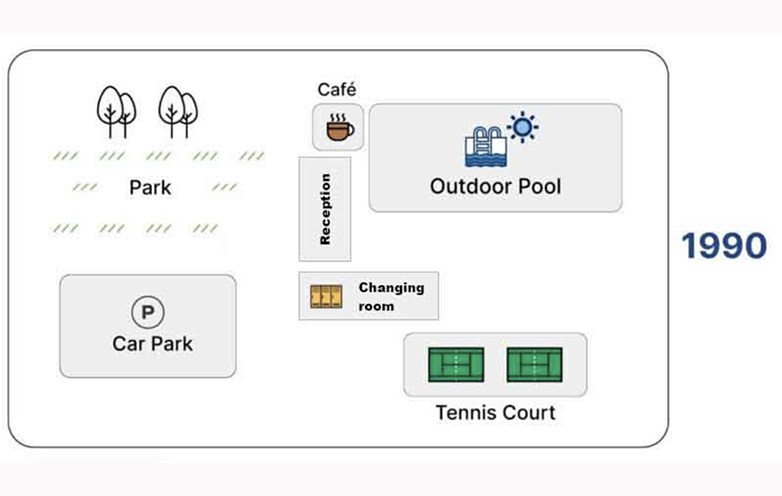
IELTS Maps
Explore how to describe maps and geographical changes.
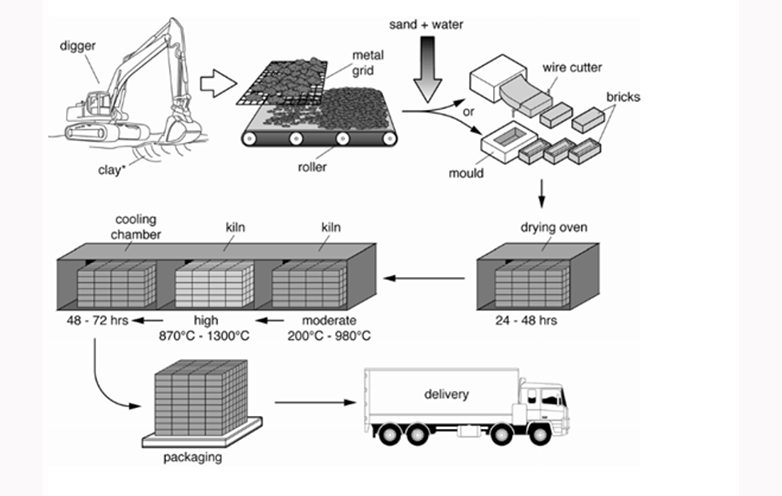
IELTS Process Diagram
Understand how to write about process diagrams step by step.

IELTS Bar Chart + Line Graph
Learn how to integrate bar charts with line graphs.

IELTS Bar Chart + Pie Chart
Master combining bar charts with pie charts in task 1.