Model answer by Lifestyle Training Centre:
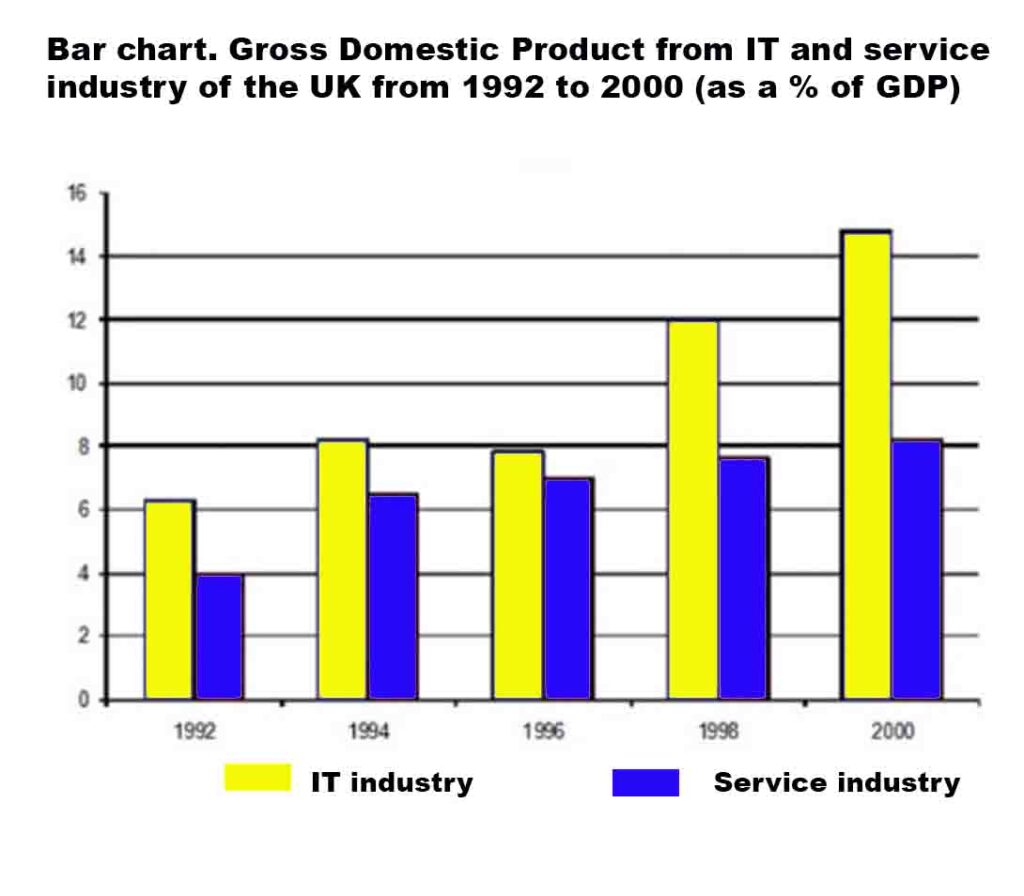
The provided bar chart delineates the Gross Domestic Product (GDP) of the United Kingdom, attributed to the Information Technology (IT) and service industry. The data spans a nine-year period, covering the years 1992 to 2000.
Overall, it is evident that the percentage of GDP witnessed a substantial increase, nearly doubling over the nine-year period for both the Information Technology and Service industries, despite minor fluctuations.
Commencing at slightly above 6% in the year 1992, the IT industry witnessed an upward trajectory, peaking at over 8% in the year 1994. Despite a marginal decline in the year 1996 to just under 8%, the GDP soared, reaching a pinnacle of approximately 15% by the year 2000.
Concurrently, the Service Industry’s GDP, starting at 4 percent in the year 1992, exhibited a consistent upward trend, culminating in a figure slightly surpassing 8 percent by the conclusion of the period in the year 2000.
List of vocabulary used:
1. Provided – supplied, given
2. Delineates – describes, outlines
3. Gross Domestic Product (GDP) – national income, economic output
4. Attributed – related, linked
5. Information Technology (IT) – computing, tech industry
6. Service industry – service sector, tertiary sector
7. Data – information, statistics
8. Spans – covers, extends over
9. Period – timeframe, duration
10. Overall – generally, in summary
11. Evident – clear, obvious
12. Witnessed – observed, experienced
13. Substantial – significant, considerable
14. Increase – rise, growth
15. Nearly – almost, close to
16. Doubling – increasing twofold, multiplying
17. Fluctuations – variations, changes
18. Commencing – beginning, starting
19. Slightly – marginally, a little
20. Upward trajectory – increasing trend, rising path
21. Peaking – reaching the highest point, hitting a maximum
22. Marginal – slight, minor
23. Decline – decrease, drop
24. Soared – skyrocketed, surged
25. Pinnacle – peak, summit
26. Approximately – about, nearly
27. Concurrently – at the same time, simultaneously
28. Exhibited – displayed, showed
29. Consistent – steady, reliable
30. Culminating – resulting, ending
31. Figure – amount, number
32. Surpassing – exceeding, going beyond
33. Conclusion – end, final point
Free admission and English Courses. കാശ് കൊടുക്കാതെ അഡ്മിഷൻ. FREE ഇഗ്ലീഷ് കോഴ്സുകൾ. ഈ ഓഫർ നേടൂ. Contact us at +91 9886926773 പ്രോസസ്സിംഗ് ആയാസകരം.

New batch is open. Join today!

Ready to study abroad or master OET, PTE, IELTS, Duolingo, Phonetics, or Spoken English?
📞 Call us now at +91 9886926773
📱 Call/WhatsApp/Text: +91 9886926773
📧 Email: mail@goltc.in
Visit us in person by following the directions on Google Maps. We look forward to welcoming you to the Lifestyle Training Centre.
Follow Lifestyle Training Centre on social media:
Thank you very much!
Pingback: IELTS bar charts – Writing task 1 Academic. | Lifestyle Training Centre®