Model answer by Lifestyle Training Centre:
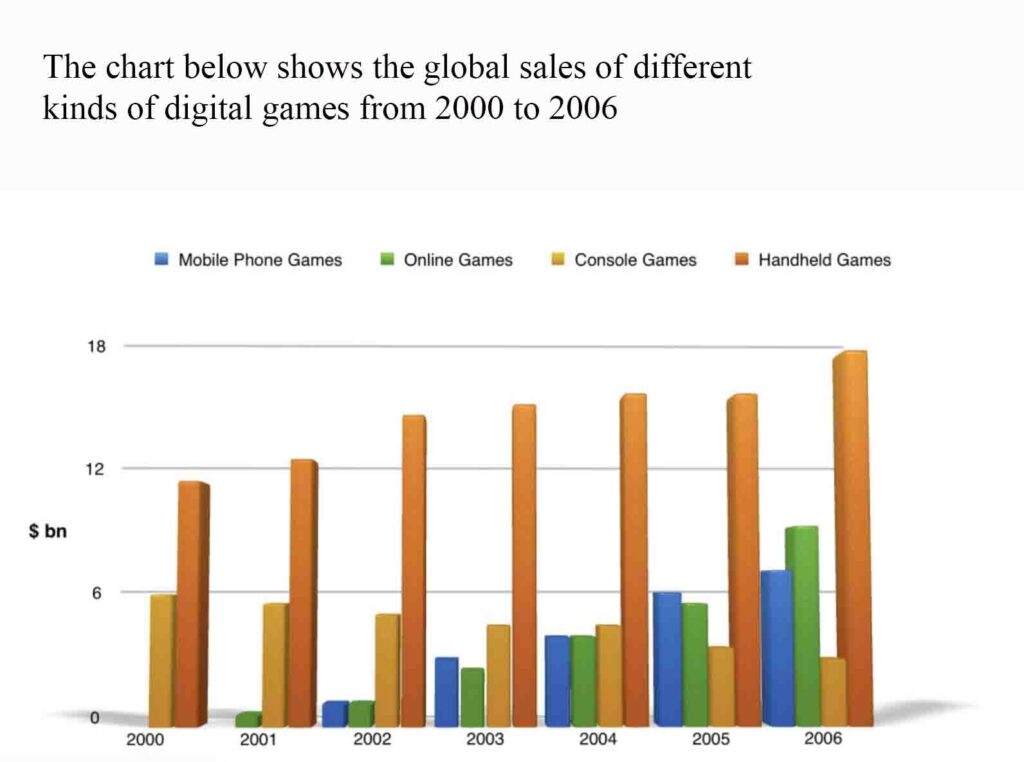
The presented bar chart meticulously outlines the global sales trajectories for four distinct categories of digital entertainment: Mobile phone games, online games, console games, and handheld games—spanning from 2000 to 2006. The monetary values are denominated in billion dollars.
Overall, it is patently evident that sales for handheld games, mobile phone games, and online games experienced a pronounced ascension throughout the seven-year period. In stark contrast, console games consistently declined in sales over consecutive years. Notably, handheld games unequivocally dominated the digital gaming market among the four categories.
Zooming in, the sales of Handheld games peaked just below $12 billion in 2000, incrementally ascending to approximately $18 billion by 2006. Online games, introduced in 2001 with initial sales below $0.5 billion, underwent a meteoric upturn, reaching around $9 billion by 2006. Similarly, Mobile phone games, emerging in 2002 with around $1 billion in sales, demonstrated marked escalation, achieving approximately $7 billion in sales by 2006.
In contradistinction, Console games, despite an initial sale of around $6 billion in 2000, exhibited a discernible decrement year on year. Although sales stabilised around $5 billion in 2003 and 2004, they subsequently plummeted to around $3 billion by 2006—almost half of the initial sale.
List of vocabulary used:
1. Presented – shown, displayed
2. Meticulously – carefully, precisely
3. Outlines – describes, depicts
4. Trajectories – trends, paths
5. Distinct – separate, unique
6. Categories – types, classes
7. Spanning – covering, extending
8. Monetary – financial, fiscal
9. Denominated – expressed, stated
10. Patently – clearly, obviously
11. Evident – apparent, noticeable
12. Experienced – underwent, encountered
13. Pronounced – significant, marked
14. Ascension – rise, increase
15. Stark – sharp, clear
16. Contrasts – comparisons, differences
17. Consistently – steadily, reliably
18. Declined – decreased, fell
19. Notably – particularly, especially
20. Unequivocally – clearly, unmistakably
21. Dominated – ruled, prevailed
22. Zooming in – focusing, narrowing down
23. Peaked – reached the highest point, culminated
24. Incrementally – gradually, step by step
25. Ascending – rising, increasing
26. Approximately – about, nearly
27. Underwent – experienced, went through
28. Meteoric – rapid, swift
29. Upturn – increase, improvement
30. Demonstrated – showed, exhibited
31. Marked – significant, noticeable
32. Escalation – increase, rise
33. Emerging – appearing, arising
34. Exhibited – displayed, showed
35. Discernible – noticeable, detectable
36. Decrement – decrease, reduction
37. Stabilised – leveled off, steadied
38. Plummeted – dropped, fell sharply
39. Initial – first, original
40. Sale – revenue, transactions
Free admission and English Courses. കാശ് കൊടുക്കാതെ അഡ്മിഷൻ. FREE ഇഗ്ലീഷ് കോഴ്സുകൾ. ഈ ഓഫർ നേടൂ. Contact us at +91 9886926773 പ്രോസസ്സിംഗ് ആയാസകരം.

New batch is open. Join today!

Ready to study abroad or master OET, PTE, IELTS, Duolingo, Phonetics, or Spoken English?
📞 Call us now at +91 9886926773
📱 Call/WhatsApp/Text: +91 9886926773
📧 Email: mail@goltc.in
Visit us in person by following the directions on Google Maps. We look forward to welcoming you to the Lifestyle Training Centre.
Follow Lifestyle Training Centre on social media:
Thank you very much!
Pingback: IELTS bar charts – Writing task 1 Academic. | Lifestyle Training Centre®