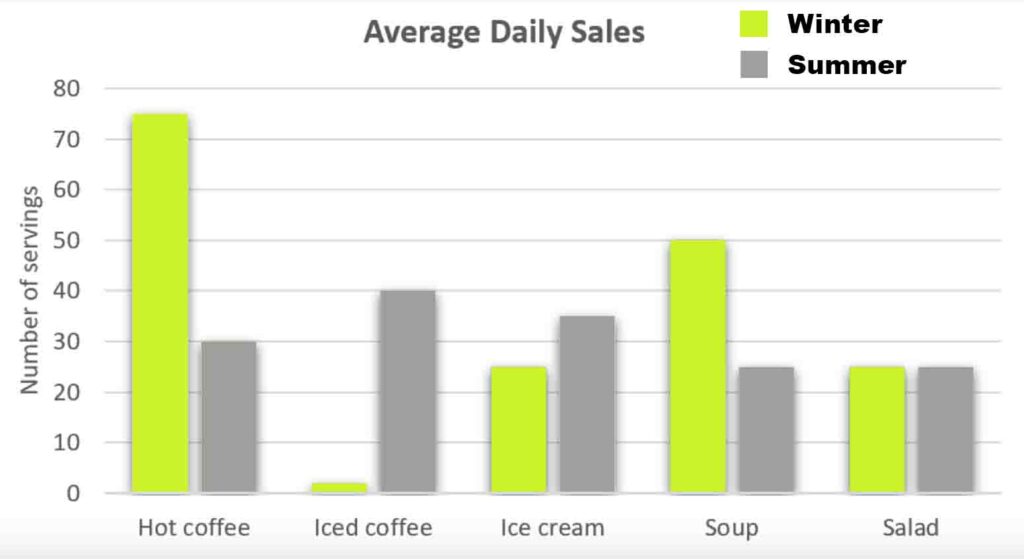
The graph below shows the average daily sales of selected food items at Starbucks, by season. Summarise the information by selecting and reporting the main features, and make comparisons where relevant. Write at least 150 words.
Model answer by Lifestyle Training Centre:
The given bar chart depicts how much, on average, five different products at Starbucks are being sold each day, based on the number of servings, during both winter and summer.
All in all, it is clear that Hot coffee and Soup experience peak sales during winter, while Iced coffee and Ice cream dominate during summer. The sale of Salad remains consistent and unaffected by seasonal variations.
While around 30 Hot coffees are served during summer, this number more than doubles during winter, reaching approximately 75 servings. Similarly, the sale of Soup doubles from around 25 servings in summer to about 50 servings in winter. Salad is served around 25 units each day during both seasons.
In winter, Iced coffee is least preferred, with only around 1 serving per day. However, notably, its sales remarkably ascends to 40 servings a day during summer. Similarly, around 25 units of Ice cream are sold during winter, markedly soaring to approximately 35 servings per day during summer.
List of vocabulary used:
1. Given – provided, supplied
2. Depicts – illustrates, represents
3. Average – mean, typical
4. Products – items, goods
5. Servings – portions, quantities
6. Winter – cold season, wintertime
7. Summer – warm season, summertime
8. All in all – overall, generally
9. Clear – evident, obvious
10. Experience – undergo, have
11. Peak – highest, maximum
12. Dominates – leads, prevails
13. Consistent – steady, uniform
14. Unaffected – unchanged, stable
15. Seasonal variations – seasonal changes, seasonal fluctuations
16. Served – offered, provided
17. More than doubles – increases by over twofold, surpasses two times
18. Reaching – attaining, hitting
19. Similarly – likewise, in the same way
20. Doubles – increases twofold, multiplies
21. Units – pieces, items
22. Preferred – favored, chosen
23. Notably – significantly, remarkably
24. Ascends – rises, increases
25. Markedly – noticeably, significantly
26. Soaring – skyrocketing, surging
27. Approximately – about, nearly
28. Sales – transactions, revenue
IELTS Speaking Task Topics
Click on any topic to explore more!
Names

Learn about the importance of names and their cultural significance.
Study / Job

Discuss various aspects of studying and working in different fields.
Hometown

Explore the charm of your hometown and its unique features.
Accomodation

Understand various types of accommodation and living situations.
Weather

Learn about how weather influences daily life and activities.
Time

Discuss the concept of time, its importance, and time management.
Television

Talk about the role of television in modern entertainment.
Museum

Discuss the cultural importance of museums and historical exhibits.
Holidays

Explore the significance of holidays and different celebrations.
Films

Learn about the impact of films on culture and society.
Leisure Time

Discuss how leisure activities impact personal well-being.
Sport

Talk about the role of sports in health, entertainment, and culture.
Vegetables and Fruits
Discuss the health benefits and importance of fresh produce.
Maths

Explore the role of mathematics in various aspects of life.
Sky

Discuss the beauty and scientific significance of the sky.
Clothes&Fashion

Explore how clothing reflects culture and personal expression.
Weekend

Discuss the importance of weekends and ways people relax.
Reading

Learn about the importance of reading and various reading habits.
Sleep

Explore how sleep impacts physical and mental well-being.
Trees&Plants

Discuss the environmental and health benefits of plants.
Newspaper

Discuss the evolving role of newspapers in the digital age.
Texting

Explore the role of text messaging in modern communication.
Memorising

Learn techniques for improving memory and memorization.
Travelling

Discuss the importance and impact of traveling in modern society.
Communication

Explore the modes and significance of communicating well
Letter&Email

Explore the differences and significance of letters vs. emails.
Swimming

Discuss the benefits of swimming for health and fitness.
Snacks

Explore the role of snacks in daily nutrition and lifestyle.
Photography

Discuss photography’s cultural and artistic significance.
Help

Talk about the importance of offering and receiving help.
History

Discuss historical events and their impact on modern society.
Handwriting

Explore the significance of handwriting in education and culture.
Music

Learn about the influence of music on emotions and society.
Colours

Discuss how colours affect perception and mood.
Teachers

Explore the role of teachers in shaping students’ futures.
Being Alone

Talk about the experience and benefits of spending time alone.
Teamwork

Learn the importance of teamwork in professional and social contexts.
Countryside & City

Explore the charm and benefits of living in the countryside.
Social Media

Discuss the impact of social media on society and relationships.
Friends

Explore the importance of friendships in life.
Artificial Intelligence (AI)

Talk about the future of AI and its role in society.
Climate Change

Discuss the causes and consequences of climate change.
Transportation
Explore different modes of transportation in your area.
Sustainable Transportation
Explore ways to make transportation more environmentally friendly.
Space Exploration

Learn about the latest advancements in space exploration.
Shopping

Explore how shopping influences culture and the economy.
Modern Technology

Discuss how modern technology is reshaping society.
Technology

Learn about the role of technology in everyday life.
Sustainable Living

Explore ways to live sustainably for the future of the planet.
Globalisation

Learn about the effects of globalisation on society and economies.
Global Warming

Discuss the causes, effects, and solutions to global warming.
Gender Equality

Explore the importance of gender equality in modern society.
Health and Fitness
Discuss the importance of maintaining a healthy lifestyle.
Renewable Energy

Learn about renewable energy sources and their impact on the environment.
Cultural Traditions in Kerala
Explore the unique cultural traditions of Kerala, your hometown.
Cultural Traditions in Your Country

Learn about the cultural traditions in your country.
Education System
Discuss the education system in your country and its effectiveness.
Traditional Cuisine
Explore the significance of traditional cuisines in your culture.
Do you need printed IELTS/ OET practice material? Place your order today. Available now for just Rs: 1,100 (including shipping all across India) Contact us at our WhatsApp number: +91 9886926773 to place your order. (Free for LTC students)
We hope this information has been valuable to you. If so, please consider a monetary donation to Lifestyle Training Centre via UPI. Your support is greatly appreciated.
Would you like to undergo training for OET, PTE, IELTS, Duolingo, Phonetics, or Spoken English with us? Kindly contact us now!
📱 Call/WhatsApp/Text: +91 9886926773
📧 Email: mail@goltc.in
Visit us in person by following the directions on Google Maps. We look forward to welcoming you to the Lifestyle Training Centre.
Follow Lifestyle Training Centre on social media:
Thank you very much!
Free admission and English Courses. കാശ് കൊടുക്കാതെ അഡ്മിഷൻ. FREE ഇഗ്ലീഷ് കോഴ്സുകൾ. ഈ ഓഫർ നേടൂ. Contact us at +91 9886926773 പ്രോസസ്സിംഗ് ആയാസകരം.
New batch is open. Join today! 🔥 Master Fluent English in Just 1 Month — Or Get 100% Refund!
🗓️ New Spoken English Batch Starts: 4th July 2025
📍 Available Online & Offline
📞 Call +91 9886926773 now to reserve your seat
🔥 ഒരുമാസത്തിനുള്ളിൽ ഇംഗ്ലീഷ് സംസാരിക്കുക – അല്ലെങ്കിൽ പണം തിരിച്ചു തരും!
🗓️ പുതിയ സ്പോക്കൺ ഇംഗ്ലീഷ് ബാച്ച് ആരംഭിക്കുന്നു: ജൂലൈ 4, 2025
📍 ഓൺലൈൻ & ഓഫ്ലൈൻ ക്ലാസുകൾ ലഭ്യമാണ്
📞 സീറ്റ് ഉറപ്പാക്കാൻ ഇപ്പോൾ +91 9886926773 വിളിക്കൂ!
Ready to study abroad or master OET, PTE, IELTS, Duolingo, Phonetics, or Spoken English?
📞 Call us now at +91 9886926773
📱 Call/WhatsApp/Text: +91 9886926773
📧 Email: mail@goltc.in
Visit us in person by following the directions on Google Maps. We look forward to welcoming you to the Lifestyle Training Centre.
Follow Lifestyle Training Centre on social media:
Thank you very much!
Pingback: IELTS bar charts – Writing task 1 Academic. | Lifestyle Training Centre®