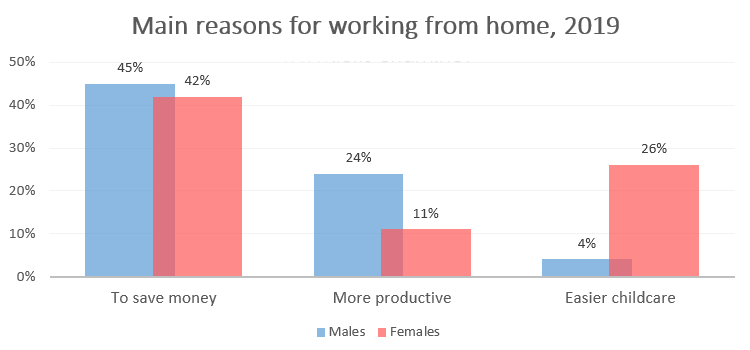
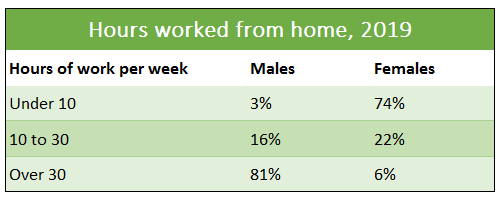
The diagrams below show the main reasons workers chose to work from home and the hours males and females worked at home for the year 2019. Summarise the information by selecting and reporting the main features, and make comparisons where relevant.
The diagrams below show the main reasons workers chose to work from home and the hours males and females worked at home for the year 2019. Summarise the information by selecting and reporting the main features, and make comparisons where relevant.
The bar chart and table show information about students from abroad studying in four English-speaking countries in 2004 and 2012. Summarise the information by selecting and reporting the main features, and make comparisons where relevant.

Model answer by Lifestyle Training Centre
The provided bar chart and table comprehensively depict the number and proportion of non-native students enrolled in higher education across four prominent English-speaking nations during the years 2004 and 2012: the United States, the United Kingdom, Australia, and Canada. Figures are represented in thousands (1000s).
Evidently, the United States boasted the highest enrolment of international students, starkly contrasting with Canada, which recorded the lowest figures. Notably, Australia exhibited the highest percentage of global student intake, while the United States held the lowest proportion.
Specifically, the United States hosted approximately 180,000 foreign students in 2004, a figure that surged to nearly 250,000 by 2012, consistently representing 2% of the total student populace. Meanwhile, the United Kingdom welcomed 120,000 expat students in 2004, constituting 9% of the national student body, a proportion that expanded to 13% in 2012, nearing a count of 200,000.
Conversely, Canada experienced the most modest numbers, accommodating around 40,000 and 60,000 immigrant students in 2004 and 2012, respectively, constituting 5% and 7% of the overall student populace. Remarkably, Australia exhibited the highest rates, with 19% in 2004 and 24% in 2012, amounting to approximately 120,000 and 190,000 students, respectively.
A mixed essay in the context of Duolingo / PTE / IELTS Writing Task 2 typically involves addressing multiple aspects of a given topic within a single essay. This format requires candidates to discuss various elements, such as causes, advantages and disadvantages, or solutions to a problem, within the same essay. For example, a mixed essay prompt might ask candidates to discuss both the causes of a particular issue and the advantages and disadvantages of potential solutions.
Model question: Asked in 16/03/2024
In some countries today, many people decide to have their first child when they are older. What are the reasons? Do you think the advantages of this outweigh the disadvantages?
Model answer by Lifestyle Training Centre
1. Mixed Causes and Effects / Advantages Outweigh Disadvantages:
– What are the factors contributing to the rise in popularity of online learning platforms, and do the benefits of online education outweigh the drawbacks?
2. Mixed Problem-Solution / Discussion:
– Discuss the challenges faced by cities in managing waste disposal and propose solutions to promote recycling and reduce landfill usage.
3. Mixed Advantages Outweigh Disadvantages / Reasons and Solutions:
– Analyse the benefits and drawbacks of remote work arrangements, and suggest measures to address issues such as isolation and work-life balance.
4. Mixed Opinion / Problem-Solution:
– Some people believe that the increasing use of technology in classrooms enhances learning outcomes, while others argue it hinders students’ social skills. What measures can schools take to strike a balance between technology integration and interpersonal development?
5. Mixed Causes and Effects / Discussion:
– What are the reasons behind the decline in traditional farming practices, and how can governments support small-scale farmers to maintain agricultural diversity and sustainability?
6. Mixed Advantages Outweigh Disadvantages / Opinion:
– To what extent do the benefits of tourism to a country’s economy outweigh the negative impacts on the environment and local culture? Share your opinion and provide examples to support your view.
7. Mixed Problem-Solution / Reasons and Solutions:
– Discuss the challenges associated with the growing aging population in many countries, and propose strategies to ensure adequate healthcare and social support for elderly citizens.
8. Mixed Causes and Effects / Discussion:
– Analyse the factors contributing to the rise in childhood obesity rates, and discuss the role of parents, schools, and governments in addressing this public health issue.
9. Mixed Advantages Outweigh Disadvantages / Reasons and Solutions:
– Consider the advantages and disadvantages of globalisation on developing economies. Additionally, propose strategies for mitigating the negative impacts of globalisation on local industries and communities.
10. Mixed Opinion / Problem-Solution:
– Some argue that strict gun control laws are necessary to reduce gun violence, while others believe in the right to bear arms. What measures can governments take to balance public safety concerns with individual freedoms regarding gun ownership?
11. Mixed Causes and Effects / Discussion:
– Examine the reasons behind the increase in urbanization and its effects on rural communities. Discuss how governments can support rural development while managing urban growth sustainably.
12. Mixed Advantages Outweigh Disadvantages / Opinion:
– To what extent do the benefits of social media outweigh the negative effects on mental health and social interactions? Share your opinion and provide evidence to support your viewpoint.
13. Mixed Problem-Solution / Reasons and Solutions:
– Discuss the challenges posed by climate change on agriculture and food security, and propose strategies to promote sustainable farming practices and ensure food sovereignty.
14. Mixed Causes and Effects / Advantages Outweigh Disadvantages:
– Analyze the reasons for the decline in traditional media outlets such as newspapers and television, and assess the benefits and drawbacks of digital media consumption.
15. Mixed Opinion / Discussion:
– Some argue that renewable energy sources are the key to combating climate change, while others advocate for nuclear power. Discuss the merits and drawbacks of both approaches to meeting energy needs in the future.
16. Mixed Causes and Effects / Advantages Outweigh Disadvantages:
– What are the factors contributing to the rise in freelance work, and do the benefits of freelancing outweigh the drawbacks?
17. Mixed Problem-Solution / Discussion:
– Discuss the challenges faced by developing countries in providing access to clean drinking water and propose solutions to ensure universal access to safe water sources.
18. Mixed Advantages Outweigh Disadvantages / Reasons and Solutions:
– Analyze the benefits and drawbacks of the gig economy, and suggest measures to address issues such as job insecurity and lack of employment benefits.
19. Mixed Opinion / Problem-Solution:
– Some argue that stricter penalties for littering are necessary to reduce environmental pollution, while others advocate for increased public awareness campaigns. What measures can governments take to effectively tackle littering?
20. Mixed Causes and Effects / Discussion:
– Examine the reasons behind the decline in traditional manufacturing industries in developed countries and discuss the impact on local economies and job markets.
21. Mixed Advantages Outweigh Disadvantages / Opinion:
– To what extent do the benefits of immigration to a country’s economy outweigh the negative impacts on social cohesion and cultural identity? Share your opinion and provide examples to support your view.
22. Mixed Problem-Solution / Reasons and Solutions:
– Discuss the challenges associated with rising healthcare costs and propose strategies to improve access to affordable healthcare for all citizens.
23. Mixed Causes and Effects / Discussion:
– Analyse the factors contributing to the decline in public transportation ridership and discuss the implications for traffic congestion and air pollution in urban areas.
24. Mixed Advantages Outweigh Disadvantages / Reasons and Solutions:
– Consider the advantages and disadvantages of telecommuting for both employers and employees, and propose measures to address common challenges such as communication barriers and social isolation.
25. Mixed Opinion / Problem-Solution:
– Some argue that stricter regulations on fast food advertising are necessary to combat rising obesity rates, while others believe in personal responsibility. What measures can governments take to promote healthier eating habits among citizens?
26. Mixed Causes and Effects / Discussion:
– Examine the reasons behind the increase in urban sprawl and its effects on land use and natural habitats. Discuss strategies for sustainable urban planning and development.
27. Mixed Advantages Outweigh Disadvantages / Opinion:
– To what extent do the benefits of cultural exchange programs outweigh the risks of cultural appropriation and misrepresentation? Share your opinion and provide evidence to support your viewpoint.
28. Mixed Problem-Solution / Reasons and Solutions:
– Discuss the challenges associated with rising income inequality and propose strategies to promote economic growth that benefits all segments of society.
29. Mixed Causes and Effects / Advantages Outweigh Disadvantages:
– Analyse the reasons for the decline in traditional brick-and-mortar retail stores and assess the benefits and drawbacks of e-commerce and online shopping.
30. Mixed Opinion / Discussion:
– Some argue that stricter immigration policies are necessary to protect domestic job markets, while others believe in the economic benefits of immigration. Discuss the social and economic implications of different approaches to immigration.
31. Mixed Causes and Effects / Advantages Outweigh Disadvantages:
• What are the factors contributing to the rise in popularity of remote work, and do the benefits of telecommuting outweigh the drawbacks?
32. Mixed Problem-Solution / Discussion:
• Discuss the challenges faced by coastal communities due to rising sea levels and propose solutions to mitigate the impacts of climate change on coastal areas.
33. Mixed Advantages Outweigh Disadvantages / Reasons and Solutions:
• Analyse the benefits and drawbacks of self-driving cars, and suggest measures to address concerns such as safety and job displacement in the transportation sector.
34. Mixed Opinion / Problem-Solution:
• Some argue that stricter regulations on social media platforms are necessary to combat online harassment and misinformation, while others advocate for freedom of speech. What measures can be implemented to balance these concerns?
35. Mixed Causes and Effects / Discussion:
• Examine the reasons behind the decline in traditional family-owned businesses and discuss the impact on local economies and community cohesion.
36. Mixed Advantages Outweigh Disadvantages / Opinion:
• To what extent do the benefits of renewable energy sources outweigh the challenges of transitioning from fossil fuels? Share your opinion and provide evidence to support your viewpoint.
37. Mixed Problem-Solution / Reasons and Solutions:
• Discuss the challenges associated with inadequate access to healthcare in rural areas and propose strategies to improve medical services and facilities in underserved communities.
38. Mixed Causes and Effects / Discussion:
• Analyse the factors contributing to the rise in mental health issues among young adults and discuss the role of social media and societal pressures in exacerbating these problems.
39. Mixed Advantages Outweigh Disadvantages / Reasons and Solutions:
• Consider the benefits and drawbacks of flexible work schedules, and propose measures to ensure productivity and work-life balance in a remote work environment.
40. Mixed Opinion / Problem-Solution:
• Some argue that stricter regulations on the food industry are necessary to combat rising obesity rates, while others believe in promoting healthy eating habits through education and awareness campaigns. What measures can governments take to address this public health issue?
41. Mixed Causes and Effects / Discussion:
• Examine the reasons behind the decline in traditional manufacturing jobs in developed countries and discuss the impact on workers and local economies.
42. Mixed Advantages Outweigh Disadvantages / Opinion:
• To what extent do the benefits of AI-driven automation outweigh the risks of job displacement and economic inequality? Share your opinion and provide evidence to support your viewpoint.
43. Mixed Problem-Solution / Reasons and Solutions:
• Discuss the challenges associated with inadequate access to clean water and sanitation in developing countries and propose strategies to improve water infrastructure and hygiene practices.
44. Mixed Causes and Effects / Discussion:
• Analyse the factors contributing to the decline in biodiversity and ecosystem loss, and discuss the implications for global ecosystems and human well-being.
45. Mixed Advantages Outweigh Disadvantages / Reasons and Solutions:
• Consider the benefits and drawbacks of remote learning for students, and propose measures to address issues such as digital divide and academic engagement in virtual classrooms.
46. Mixed Opinion / Problem-Solution:
• Some argue that stricter regulations on air pollution are necessary to combat climate change and protect public health, while others advocate for economic growth and job creation. What measures can governments take to balance environmental concerns with economic development?
47. Mixed Causes and Effects / Discussion:
• Examine the reasons behind the rise in income inequality and wealth concentration, and discuss the social and economic consequences for society.
48. Mixed Advantages Outweigh Disadvantages / Opinion:
• To what extent do the benefits of globalization outweigh the challenges of economic inequality and cultural homogenisation? Share your opinion and provide evidence to support your viewpoint.
49. Mixed Problem-Solution / Reasons and Solutions:
• Discuss the challenges associated with food insecurity and malnutrition in developing countries and propose strategies to improve agricultural productivity and access to nutritious food.
50. Mixed Causes and Effects / Advantages Outweigh Disadvantages:
• Analyse the reasons for the decline in traditional brick-and-mortar retail stores and assess the benefits and drawbacks of e-commerce and online shopping.
51. Mixed Opinion / Discussion:
• Some argue that stricter immigration policies are necessary to protect domestic job markets, while others believe in the economic benefits of immigration. Discuss the social and economic implications of different approaches to immigration.
52. Mixed Causes and Effects / Advantages Outweigh Disadvantages:
• What are the factors contributing to the rise in popularity of ride-sharing services, and do the benefits of these services outweigh the drawbacks?
53. Mixed Problem-Solution / Discussion:
• Discuss the challenges faced by developing countries in providing access to quality education for all children, and propose solutions to ensure equitable access to schooling.
54. Mixed Advantages Outweigh Disadvantages / Reasons and Solutions:
• Analyse the benefits and drawbacks of online shopping, and suggest measures to address issues such as data privacy and consumer protection in e-commerce.
55. Mixed Opinion / Problem-Solution:
• Some argue that stricter regulations on plastic usage are necessary to reduce environmental pollution, while others believe in consumer education and voluntary initiatives. What measures can governments take to effectively reduce plastic waste?
56. Mixed Causes and Effects / Discussion:
• Examine the reasons behind the decline in traditional music sales and discuss the impact of digital streaming platforms on the music industry.
57. Mixed Advantages Outweigh Disadvantages / Opinion:
• To what extent do the benefits of space exploration outweigh the costs? Share your opinion and provide examples to support your view.
58. Mixed Problem-Solution / Reasons and Solutions:
• Discuss the challenges associated with aging infrastructure in urban areas and propose strategies for modernising and maintaining critical infrastructure systems.
59. Mixed Causes and Effects / Discussion:
• Analyse the factors contributing to the rise in mental health issues among adolescents and discuss the role of schools and communities in promoting mental well-being.
60. Mixed Advantages Outweigh Disadvantages / Reasons and Solutions:
• Consider the benefits and drawbacks of artificial intelligence in healthcare, and propose measures to address concerns such as data security and ethical implications.
We hope this information has been valuable to you. If so, please consider a monetary donation to Lifestyle Training Centre via UPI. Your support is greatly appreciated.

Would you like to undergo training for OET, PTE, IELTS, Duolingo, Phonetics, or Spoken English with us? Kindly contact us now!
📱 Call/WhatsApp/Text: +91 9886926773
📧 Email: [email protected]
Visit us in person by following the directions on Google Maps. We look forward to welcoming you to the Lifestyle Training Centre.
Follow Lifestyle Training Centre on social media:
Thank you very much!

ASKED FOR IELTS EXAM ON 16/03/2024
In some countries today, many people decide to have their first child when they are older. What are the reasons? Do you think the advantages of this outweigh the disadvantages?
Model answer by Lifestyle Training Centre
Nowadays, it is customary among many Individuals in certain nations to delay parenthood. While there are a couple of plausible rationales I can think of behind this notion, I firmly believe that the advantages unequivocally outweigh the potential downsides.
Primarily, financial instability emerges as a significant deterrent to early parenthood for many individuals. Taking on the role of parents in a later stage in life definitely would mean more financial freedom and less pecuniary pressures. For instance, it is pervasive that most marriages end up in divorce primarily due to financial constraints. Additionally, emotional maturity or readiness play a vital role here. With age comes wisdom. Thus, this delay supposedly benefits couples who will get ample time to equip themselves before embarking on the journey towards child rearing. Finally, the desire for personal freedom and space has become increasingly important for young couples, who prioritise their independence and lifestyle choices over the commitments associated with raising children. This would, thus, benefit in marital fulfilment and less worry over bringing up offspring during one’s prime.
While the aforementioned benefits of delaying parenthood are valid, there are minor setbacks to consider. Firstly, advancing age can have an impact on fertility, potentially reducing the success rate of conception. In other words, as individuals grow older, the likelihood of successfully conceiving a child decreases. Secondly, older parents may encounter challenges in effectively nurturing and deeply engaging with their children, particularly in activities that demand physical fitness, as age could pose a barrier to active involvement. However, these potential downsides can be counteracted with the help of modern technology and by maintaining an active and fit lifestyle. Nowadays, young women have even the option to harvest and save their eggs for use in the later stage of their life.
To conclude, while there are certain downsides to delaying pregnancy and upbringing of children motivated by factors such as financial freedom, maturity, and marital fulfilments and freedom, the benefits of such choices far outweigh the potential demerits. If more people consider these factors, marriages could experience more success rates, financial freedom, and fulfilment.
We hope this information has been valuable to you. If so, please consider a monetary donation to Lifestyle Training Centre via UPI. Your support is greatly appreciated.
Would you like to undergo training for OET, PTE, IELTS, Duolingo, Phonetics, or Spoken English with us? Kindly contact us now!
📱 Call/WhatsApp/Text: +91 9886926773
📧 Email: [email protected]
Visit us in person by following the directions on Google Maps. We look forward to welcoming you to the Lifestyle Training Centre.
Follow Lifestyle Training Centre on social media:
Thank you very much!

Mock test on 08-03-2024. Score 155

We hope this information has been valuable to you. If so, please consider a monetary donation to Lifestyle Training Centre via UPI. Your support is greatly appreciated.
Would you like to undergo training for OET, PTE, IELTS, Duolingo, Phonetics, or Spoken English with us? Kindly contact us now!
📱 Call/WhatsApp/Text: +91 9886926773
📧 Email: [email protected]
Visit us in person by following the directions on Google Maps. We look forward to welcoming you to the Lifestyle Training Centre.
Follow Lifestyle Training Centre on social media:
Thank you very much!
4. IELTS process diagram. Generating electricity from wave.
The diagrams below show a structure that is used to generate electricity from wave power. Summarise the information by selecting and reporting the main features, and make comparisons where relevant.

Model answer by Lifestyle Training Centre – Band 9
The provided process diagram meticulously illustrates the complex mechanisms, components, and steps that are involved in harnessing tidal wave energy, for the production of clean electricity.
As a whole, the process encompasses tidal waves, a conduit chamber, a column, and a turbine that rotates and produces electricity. While the first image showcases how electricity is produced using flood tide, the second, ebb tide.
The Flood tide, channelled through the chamber, as it moves toward the shore, pushes out the trapped air in the connected column, which is built on a cliff or sea wall. Consequently, a turbine located in the middle of the column rotates clockwise, inducing the production of electricity.
In contrast, during ebb tide, the receding tidal waves create a vacuum within the chamber. As a result, the air inside moves downward, driving the turbine clockwise and generating electricity. The generated electricity can then be harvested and used.
(Word count: 150)
Do you need printed IELTS/ OET practice material? Place your order today. Available now for just Rs: 1,100 (including shipping all across India) Contact us at our WhatsApp number: +91 9886926773 to place your order. (Free for LTC students)

We hope this information has been valuable to you. If so, please consider a monetary donation to Lifestyle Training Centre via UPI. Your support is greatly appreciated.
Would you like to undergo training for OET, PTE, IELTS, Duolingo, Phonetics, or Spoken English with us? Kindly contact us now!
📱 Call/WhatsApp/Text: +91 9886926773
📧 Email: [email protected]
Visit us in person by following the directions on Google Maps. We look forward to welcoming you to the Lifestyle Training Centre.
Follow Lifestyle Training Centre on social media:
Thank you very much!
1.C
2 .D
3.A
4.B
5.A
6.C
7.B
8. chemokines
9. Th17 cytokines
10. wide variation in anti-SSA prevalence across different RA populations.
11. Anti SSA
12.CXCL10
13. serum chemokines
14. relation between RF seropositivity & CXCL10 levels
15. Serum Chemokine
16.3-16%
17. Seropositivity
18. Cxcl10 And Cxcl13
19. Anti- Ssa In Aa
20.Cxcl10
Reading test – Part B: Answer Key
1. Steps to improving interpersonal communication with patients.
2 is associated with various anomalies.
3. Can have a detrimental effect on elderly people.
4. Future course of action.
5. The majority of patients remained hospitalized for 5 days or more
6. The majority of the patients were females.
Reading test – Part C: Answer Key
Text 1 – Answer key 7 – 14
7. Affects a higher number of men than women.
8. Arthritis in its final stage.
9. Rebuilding of bone is accelerated.
10. Lower back pain, loss of hearing and discomfort.
11. Correct Answer Is: Pagets disease, is both heritable and inheritable.
12. Increase is indicative of the development of the bone at a rapid speed.
13. Should be taken only during the morning.
14. Correct Answer Is: Surgery can get rid of Pagets disease.
PART C. Text 2 – Answer key 15 – 22
15. Benign and malignant
16. When harmful tumors invade and destroy other healthy tissues of the body.
17. Exocrine gland
18. Exocrine gland
19. Cancerous tissues in the pancreas
20. Genetic mutations
21. Pesticides, dyes and chemicals used for refining metals
22. Pulmonary edema and enlargement of the gallbladder
We hope this information has been valuable to you. If so, please consider a monetary donation to Lifestyle Training Centre via UPI. Your support is greatly appreciated.
Would you like to undergo training for OET, PTE, IELTS, Duolingo, Phonetics, or Spoken English with us? Kindly contact us now!
📱 Call/WhatsApp/Text: +91 9886926773
📧 Email: [email protected]
Visit us in person by following the directions on Google Maps. We look forward to welcoming you to the Lifestyle Training Centre.
Follow Lifestyle Training Centre on social media:
Thank you very much!
RHEUMATOID ARTHRITIS (RA)
Text A
Rheumatoid arthritis (RA) has wide variability in both its clinical presentation and its
autoantibody profile. Two well-known autoantibodies that are found in between 60-90% of RA patients are rheumatoid factor (RF) and cyclic citrullinated peptide (CCP) antibody. Seropositivity for these antibodies is associated with more destructive joint pathology and radiographic progression of RA. Anti-Sjogren’s Syndrome related Antigen A (SSA) is associated with numerous autoimmune conditions, including most notably Sjogren’s Syndrome. Anti-SSA is also found in between 3-16% of RA patients and it is believed to be a clinical indicator of poor prognosis in RA. Several studies have shown that RA patients with this antibody have a lesser clinical response to infliximab.
Anti-SSA seropositivity is also associated with secondary Sjogren’s Syndrome. RA with secondary Sjogren’s Syndrome is associated with worse clinical manifestations and increased antinuclear antibody (ANA) positivity. The prevalence of ANA and anti-SSA has been shown to be higher in African American (AA) RA patients compared to Caucasian (CAU) RA patients in two established RA cohorts.
Text B
In RA, inflammatory cytokines such as tumor necrosis factor-alpha (TNF-a) and interferongamma (IFN-y) are the primary inducers of chemokine production. Chemokines then lead to increased numbers of inflammatory cells, such as macrophages, lymphocytes, and fibroblast-like synoviocytes, in inflamed synovial tissue. Chemokines also contribute to cartilage degradation and pannus formation by stimulating the release of various inflammatory cytokines. Several studies have shown that serum chemokines including CX3CL1, CCLS, CXCL9, and CXCL10 are increased in active RA patients compared to healthy controls.. Particularly, several studies have found that CXCL10 could serve as a disease activity marker in RA. Elevated CXCL10 and CXCL13 levels have been shown to be predictive of a favorable response to TNF inhibitor therapy. Studies have also shown that serum chemokine levels, including CXCL9, CXCL10 and CXCL16 decrease after treatment with disease-modifying antirheumatic drugs or biologic agents.
Text C
Previous studies have shown a wide variation in anti-SSA prevalence across different RA
populations. It is possible that the increased frequency of anti- SSA in AA subjects may be due to an increased frequency of secondary Sjogren’s Syndrome. Co-existent RA and SS may then partially explain the increased disease activity and worse clinical outcomes seen in AA RA patients. However, it was not possible to determine the prevalence of Sjogren’s Syndrome in our cohort with the available data. The AA group also had a higher prevalence of anti-SSB than the CAU group (4.26% vs. 1.08%). This was not a statistically significant difference; however, there were only 5 total patients that were anti-SSB positive. The biological and clinical implications of the increased prevalence of anti-SSA and ANA in AA RA patients are currently unknown. However, several studies have suggested that autoantibody profiles may be clinically significant. Specifically, antiSSA has been shown to be associated with more severe disease in multiple connective tissue disease and it is also involved in the molecular pathogenesis of immune dysregulation in Sjogren’s Syndrome.
Text D
In RA, a predominance of Th17 cytokines, including IFN-y and TNF have been suggested to be of pathological importance. IFN-y induces several chemokines including CXCL9, CXCL10, and CXCL11. Increased CXCL10 has been detected in the serum and synovial fluid of RA patients and in the saliva of Sjogren’s Syndrome patients compared to healthy controls. Additionally, this chemokine may have clinical significance as a human phase Il clinical trial using an anti-CXCL10 monoclonal antibody (MDX-1100) showed a significantly increased response rate in RA patients who had an inadequate response to methotrexate therapy. The study revealed an association between RF seropositivity and increased CXCL10 levels but it found no association between antiSSA positivity and CXCL10. Therefore, while the increased clinical severity seen in AA RA patients may be associated with a higher prevalence of anti-SSA, the presence of this autoantibody does not appear to directly affect the expression of CXCL10.
PART A -QUESTIONS AND ANSWER SHEET
Questions 1-7. For each of the questions, 1-7, decide which text (A, B, C or D) the information comes from. You may use any letter more than once.
In which text can you find information about;
Questions 8-14. Answer each of the questions, 8-14, with a word or short phrase from one of the texts. Each answer may include words, numbers or both. Your answers should be correctly spelt.
Questions 15-20. Complete each of the sentences, 15-20, with a word or short phrase from one of the texts. Each answer may include words, numbers or both. Your answers should be correctly spelt.
15. __________ levels often go down when target-specific drugs are used.
16. Anti-SSA is found in between__________ of RA patients
17. __________ can be defined as having or being a positive serum reaction especially in a test for the presence of an antibody
18. Increased __________ levels are known to be predictive of a favourable response to TNF inhibitor therapy.
19. The reason for the increased frequency of __________can be directly linked to enhanced frequency of secondary Sjogren’s Syndrome.
20. The research performed clearly indicate that there is no association between antiSSA positivity and __________
READING SUB-TEST: PART B
In this part of the test, there are six short extracts relating to the work of health professionals .
For questions 1-6, choose the answer (A, B or C) which you think fits best according to the text. Write your answers on the separate Answer Sheet
Questions 1-6
1. The manual talks about;
A. Steps to improving interpersonal communication with patients.
B. How to effectively deal with the patients.
C. Steps with regard to clinician-patient communication.
Important Steps – Dealing With Patients
1. Slow down. Communication can be improved by speaking slowly, and by spending just a small amount of additional time with each patient. This will help foster a patient centered approach to
the clinician-patient interaction. 2. Use plain, nonmedical language. Explain things to patients like you would explain them to your grandmother. 3. Show or draw pictures. Visual images can improve the patient’s recall of ideas. 4. Limit the amount of information provided – and repeat it. Information is best remembered when it is given in small pieces that are pertinent to the tasks at hand. Repetition further enhances recall. 5. Use the “teach-back” technique. Confirm that patients understand by asking them to repeat back your instructions. 6. Create a shame-free environment: Encourage questions. Make patients feel comfortable asking questions. Consider using the Ask-Me-3 program. Enlist the aid of others (patient’s family or friends) to promote understanding.
2. Duodenal duplication;
Duodenal duplication: Duodenal duplication is an extremely rare pathology. It represents 4% of all digestive tract congenital malformations. It is often connected with intestinal malrotation, scalloped vertebras).
In one of the cases, the degeneration arose on mucous membrane of gastric type within the cyst of duplication and in the second it was duodenal mucous membrane. The diagnosis of cancer was made in both cases on the surgical pieces at anatomopathology. There had been no biopsy within the cyst. This malformation appears in 70% of the cases before one year of the age but the late revelation is possible. The digestive obstruction is the most frequent mode of revelation. Acute pancreatitis was reported and sometimes the diagnosis can be delayed many years. The duodenal duplication, the anomaly of the embryogenesis, is diagnosed most of the time in the childhood, even by prenatal diagnosis. The average age at the time of the diagnosis is from four months to nine years. Prevalence is lightly in favour of the male.
3. Anti-reabsorption medications
Anti-reabsorption medications: Presently, anti-reabsorption medications are most widely used for treating osteoporosis. Zoledronic acid (Aclasta) is a common clinical anti-reabsorption medication. As the third generation of bisphosphonates (BPs), it outperforms the previous nitrogen-containing BPs in improving patients balance and quality of life by inhibiting bone resorption and increasing bone mineral density (BMD). It is administered via intravenous drip infusion once a year, which, therefore, brings good compliance with treatment. However, those who have been treated with zoledronic acid intravenously are likely to suffer from acute side effects, such as fever, bone and joint pain and flu-like symptoms, especially after the first administration. Although the common adverse reactions generally disappear within 72 h, or in rare cases, last 7 to 10 days without recurrence, they have serious impacts on the aging population, especially those with underlying diseases. Thus, the patients who are afraid of any adverse reactions or have suffered from any side effects during the first administration may show poor compliance with the second dose and refuse the clinical application of zoledronic acid.
4. The given notice talks about;
Cancer – Brief Overview: Historically, individuals with cancer have rarely survived past the latency periods inherent to the development of treatment-induced malignancies, but improvements in systemic and radiation therapy have increased the time for these second primaries to emerge. In the past 15 years, advances in cancer diagnostics, therapy and supportive care have significantly increased disease free survival and overall survival rates in cancer patients. A proper care plan is reported to haveincreased 10 or more years beyond their initial diagnosis and introduced the potential for secondary cancers induced by therapy. It is possible that the incidence of treatment-induced cancers may increase in the future. Long-term toxicity of cancer treatments both from systemic chemotherapy and radiation therapy become an important survivorship concern for patients and their physicians.
5. What is correct about the surgery performed?
| Evaluated Factor | n | % | p-value’ |
| Length of hospital staya | |||
| 4 days | 16 | 30.8 | 0.926 |
| 5 days | 18 | 34.6 | |
| 6 or more | 18 | 34.6 | |
| Minimum-maximum | 4-51 | ||
| Average # Standard Deviation | 7.2 ±8.5 | ||
| Type of surgery | |||
| TKA-right knee | 38 | 47.5 | 0.655 |
| TKA-left knee | 42 | 52.5 | |
| Duration of surgery (in hours) | |||
| Up to 2 hours | 15 | 18.5 | <0.001 |
| Between 2 and 3 hours | 60 | 74.1 | |
| Above 3 hours | 6 | 7.4 | |
| Minimum-maximum | 1.6 – 3.3 | ||
| Average # Standard Deviation | 2.4± 0.4 | ||
6. The table clearly shows that;
| Factor evaluated | n | % | |
| Gender | |||
| Male | 17 | 21.0 | <0.001 |
| Female | 64 | 79.0 | |
| Age | |||
| Less than 60 years | 19 | 23.5 | 0.028 |
| 60 to 70 years | 38 | 46.9 | |
| Over 70 years | 24 | 29.6 |
READING SUB-TEST: PART C
In this part of the test, there are two texts about different aspects of healthcare.
For questions 7-22, choose the answer (A, B, C or D) which you think fits best according to the te› Write your answers on the separate Answer Sheet
Text 1: Paget’s Disease
Paget’s disease of the bone is an unusual, chronic bone condition that occurs in only about 1% of people in the United States and slightly more often in men than in women (3 to 2). Individuals with Paget’s disease experience rapid bone repair, which causes a variety of symptoms from softer bones to enlarged bone growth, typically in the pelvis, lower back (spine), hips, thighs, head (skull) and arms. Medical therapies have proven effective in reducing the frequency of pain, fractures and arthritis that may be caused by this condition. Paget’s disease typically occurs in the older population and usually only in a few of their bones. Bones become large and soft, leading to problems such as bending, breaking, pinched nerves, arthritis and reduced hearing. Effective and safe treatment methods can help most people with Paget’s disease.
The cause of Paget’s disease is unknown. It does appear to be, at least partially, hereditary, perhaps when activated by exposure to a virus. Indicative of the hereditary consideration: Paget’s disease occurs more commonly in European populations and their descendants. In 30% of cases, disease incidents often involve more than one member of a family. Paget’s is rarely discovered in individuals before they reach the age of 40, and the number of people identified increases in each progressive age group. Typically, it is the appearance of the bones on an X-ray that prompts the physician to make the diagnosis. Blood tests taken most often will indicate an increase in serum alkaline phosphatase (SAP), which is reflective of the rapid new bone turnover. Urine test results will also indicate the speed at which this rebuilding is taking place. Physicians usually obtain a non-invasive bone scan to determine the extent of bone involvement. Only if cancer is suspected will it be necessary to do a bone biopsy to examine it under a microscope.
Treatment approaches can focus on providing physical assistance, including the addition of wedges in the shoe, canes as walking aids and the administration of physical therapy (this is considered to be the best). Medications that help reduce the pain associated with Paget’s include acetaminophen (e.g. Tylenol) and anti-inflammatory drugs such as ibuprofen and naproxen. In addition, a group of medications called bisphosphonates reduce the pain and help the body regulate the bone-building process to stimulate more normal bone growth. Your physician may prescribe an oral medication such as Alendronate (Fosamax) or etidronate (Didronel) to be taken orally every day for 6 months; Tiludronate (Skelid) to be taken orally every day for 3 months, Risedronate (Actonel) to be taken orally every day for 2 months. All oral medications should be taken with a large glass of water (6-8 oz) upon rising in the morning. Patients should remain upright for the next 30 minutes and not eat until that time has passed. Any of these treatments can be repeated if necessary. Side effects of these medicines may involve heartburn and sometimes an increase in bone pain for a short period of time.Normally, as people age, their bones rebuild at a slower rate. For those with Paget’s disease, however, this process of rebuilding bones takes place at a faster rate. As a result, the rebuilt bone has an abnormal structure. The involved bone can be soft, leading to weakness and bending of the pelvis, lower back (spine), hips, thighs, head and arms. Or, the rebuilt bone can enlarge, making it more susceptible to arthritis, hearing loss, fractures and discomfort. Given that this takes place in those over the age of 40, the symptoms are often mistaken for changes associated with aging.
There are also injectable medications that can be given to a patient for Paget’s which include Pamidronate (Aredia), which is injected into the vein once a month or once every few months. The injection takes a few hours. Unusually, there is inflammation of the eye or loss of bone around the teeth (osteonecrosis); Zoledronate (Reclast), which is injected in the vein once a year. The injection takes less than 30 minutes; Calcitonin, a hormone that is injected under the skin several times a week. Surgery for arthritis caused by Paget’s disease is effective in reducing pain and improving function. Medical treatment is not expected to correct some of the changes of the Paget’s disease that have already occurred, such as hearing loss, deformity or osteoarthritis.
Text 1: Questions 7-14
7. Pagets disease;
8. Pagets disease can lead to;
9. Pagets disease is a condition in which;
10. Reformation of the bones can lead to;
11. Which of the following statements is right as per the given information in the passage?
12. Pick the correct statement as per the given information in the passage;
13. What is right about oral medications?
14. Which of the following statements is incorrect as per the given information in the passage?
Text 2: Pancreatic Cancer
Cancer is a class of diseases characterized by out-of-control cell growth, and pancreatic cancer occurs when this uncontrolled cell growth begins in the pancreas. Rather than developing into healthy, normal pancreas tissue, these abnormal cells continue dividing and form lumps or masses of tissue called tumors. Tumors then interfere with the main functions of the pancreas. If a tumor stays in one spot and demonstrates limited growth, it is generally considered to be benign. More dangerous, or malignant, tumors form when the cancer cells migrate to other parts of the body through the blood or lymph systems. When a tumor successfully spreads to other parts of the body and grows, invading and destroying other healthy tissues, it is said to have metastasized. This process itself is called metastasis, and the result is a more serious condition that is very difficult to treat. In the United States each year, over 30,000 people are diagnosed with pancreatic cancer.
Europe sees more than 60,000 diagnosed each year. In Asian countries, numbers can be even higher than that.
Pancreatic cancer is categorized depending on whether it affects the exocrine or endocrine functions of the pancreas. There is an important distinction between the two broad types of pancreatic cancer because they have different risk factors, causes, symptoms, diagnostic tests, treatments, and prognosis. Tumors that affect the exocrine functions are the most common type of pancreatic cancer. Sometimes these tumors or cysts are benign, called cystadenomas. However, it is more likely to find malignant tumors called adenocarcinomas, which account for 95% of exocrine pancreatic cancers. Adenocarcinomas typically start in gland cells in the ducts of the pancreas, but they can also arise from pancreatic enzyme cells (acinar cell carcinoma). Other types of pancreatic cancers that are associated with exocrine functions include adenosquamous carcinomas, squamous cell carcinomas, and giant cell carcinomas, named for their appearances underneath a microscope. There is also a disease called ampullary cancer (carcinoma of the ampulla of Vater) that starts where the bile duct and pancreatic duct meet the duodenum of the small intestine.
Cancer is ultimately the result of cells that grow uncontrollably and do not die. Normal cells in the body follow an orderly path of growth, division, and death. Programmed cell death is called apoptosis, and when this process breaks down, cancer occurs. Pancreatic cancer cells do not experience programmatic death, but instead, continue to grow and divide. Although scientists do not know exactly what causes these cells to behave in this way, they have identified several potential risk factors. Cancer can be the result of a genetic predisposition that is inherited from family members. It is possible to be born with certain genetic mutations or a fault in a gene that makes one statistically more likely to develop cancer later in life.
About 10% of pancreatic cancers are thought to be caused by inherited gene mutations. Genetic syndromes that are associated with pancreatic cancer include hereditary breast and ovarian cancer syndrome, melanoma, pancreatitis, and non-polyposis colorectal cancer (Lynch syndrome).
Carcinogens are a class of substances that are directly responsible for damaging DNA, promoting or aiding cancer. Certain pesticides (dyes may also be included in this list here), and chemicals used in purification of the metal are thought to be carcinogenic, increasing the risk of developing pancreatic cancer. When our bodies are exposed to carcinogens, free radicals have formed that try to steal electrons from other molecules in the body. These free radicals damage cells, affecting their ability to function normally, and the result can be cancerous growths. As we age, there is an increase in the number of possible cancer-causing mutations in our DNA. This makes age an important risk factor for pancreatic cancer, especially for those over the age of 60. There are several other diseases that have been associated with an increased risk of cancer of the pancreas. These include cirrhosis or scarring of the liver, Helicobacter pylori infection (infection of the stomach with the ulcer-causing bacteria H. pylori), diabetes mellitus, chronic pancreatitis (inflammation of the pancreas), and gingivitis or periodontal disease.
In order to detect pancreatic cancer, physicians will request a complete physical examination as well as personal and family medical histories. The way in which cancer presents itself will differ depending on whether the tumor is in the head or the tail of the pancreas. Tail tumors present with pain and weight loss while head tumors present with steatorrhea, weight loss, and jaundice. Doctors also look for recent onset of atypical diabetes mellitus, Trousseau’s sign, and recent pancreatitis. In general, when making a pancreatic cancer diagnosis, physicians pay special attention to common symptoms such as abdominal or back pain, weight loss, poor appetite, tiredness, irritability, digestive problems, gallbladder enlargement, blood clots (deep venous thrombosis (DVT) or pulmonary embolism), fatty tissue abnormalities, diabetes, swelling of lymph nodes, diarrhea, steatorrhea, and jaundice.
PART C Text 2: Questions 15-22
15. Pancreatic tumors can be;
16. Metastasized is a condition
17. Pancreatic cancer is most commonly associated with.
18. Ampullary cancer is associated with.
19. Failure of apoptosis results in;
20. A cancerous growth in the pancreas is a result of;
21. The risk of pancreatic cancer is associated with these carcinogens;
22. One of these is not a symptom associated with PC;
END OF READING TEST, THIS BOOKLET WILL BE COLLECTED
VIEW ANSWER KEYSOET READINGOET SPEAKINGOET ROLE PLAYSOET LETTER WRITINGOET LISTENINGWe hope this information has been valuable to you. If so, please consider a monetary donation to Lifestyle Training Centre via UPI. Your support is greatly appreciated.
Would you like to undergo training for OET, PTE, IELTS, Duolingo, Phonetics, or Spoken English with us? Kindly contact us now!
📱 Call/WhatsApp/Text: +91 9886926773
📧 Email: [email protected]
Visit us in person by following the directions on Google Maps. We look forward to welcoming you to the Lifestyle Training Centre.
Follow Lifestyle Training Centre on social media:
Thank you very much!
Would you like to download a copy of the practice test? Please click on the download button below:

We hope this information has been valuable to you. If so, please consider a monetary donation to Lifestyle Training Centre via UPI. Your support is greatly appreciated.
Would you like to undergo training for OET, PTE, IELTS, Duolingo, Phonetics, or Spoken English with us? Kindly contact us now!
📱 Call/WhatsApp/Text: +91 9886926773
📧 Email: [email protected]
Visit us in person by following the directions on Google Maps. We look forward to welcoming you to the Lifestyle Training Centre.
Follow Lifestyle Training Centre on social media:
Thank you very much!