Model answer by Lifestyle Training Centre
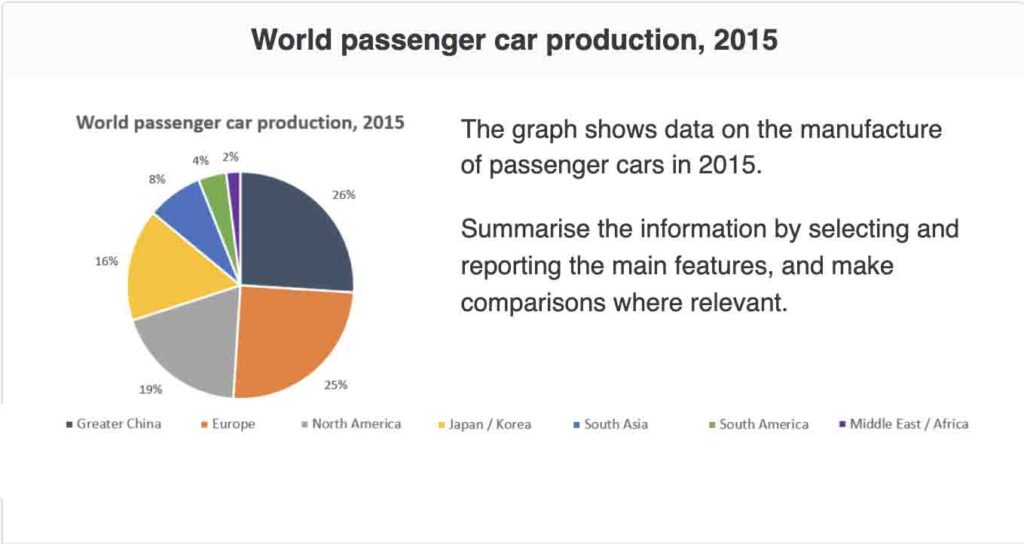
The provided pie chart delineates the distribution of global car production in the year 2015 across different regions, including Greater China, Europe, North America, Japan/Korea, South Asia, South America, and Middle East/Africa.
Overall, it is evident that Greater China, Europe, North America, and Japan/Korea were accounted for the largest shares of car production, while South Asia, South America, and the Middle East/Africa region contributed comparatively smaller percentages. Notably, Greater China emerged as the leading producer globally, while Middle East/Africa represented the smallest share of production.
Delving into the specifics, Greater China dominated the global car production landscape with a substantial 26% share. Europe closely followed, accounting for exactly one-quarter of the total production. North America and Japan/Korea claimed 19% and 16% of the market, respectively, demonstrating their significant contributions to the industry.
Conversely, South Asia, South America, and the Middle East/Africa region contributed smaller shares of 8%, 4%, and 2%, respectively, reflecting their relatively limited presence in the global car manufacturing arena.