The bar chart and table show information about students from abroad studying in four English-speaking countries in 2004 and 2012. Summarise the information by selecting and reporting the main features, and make comparisons where relevant.
Model answer by Lifestyle Training Centre
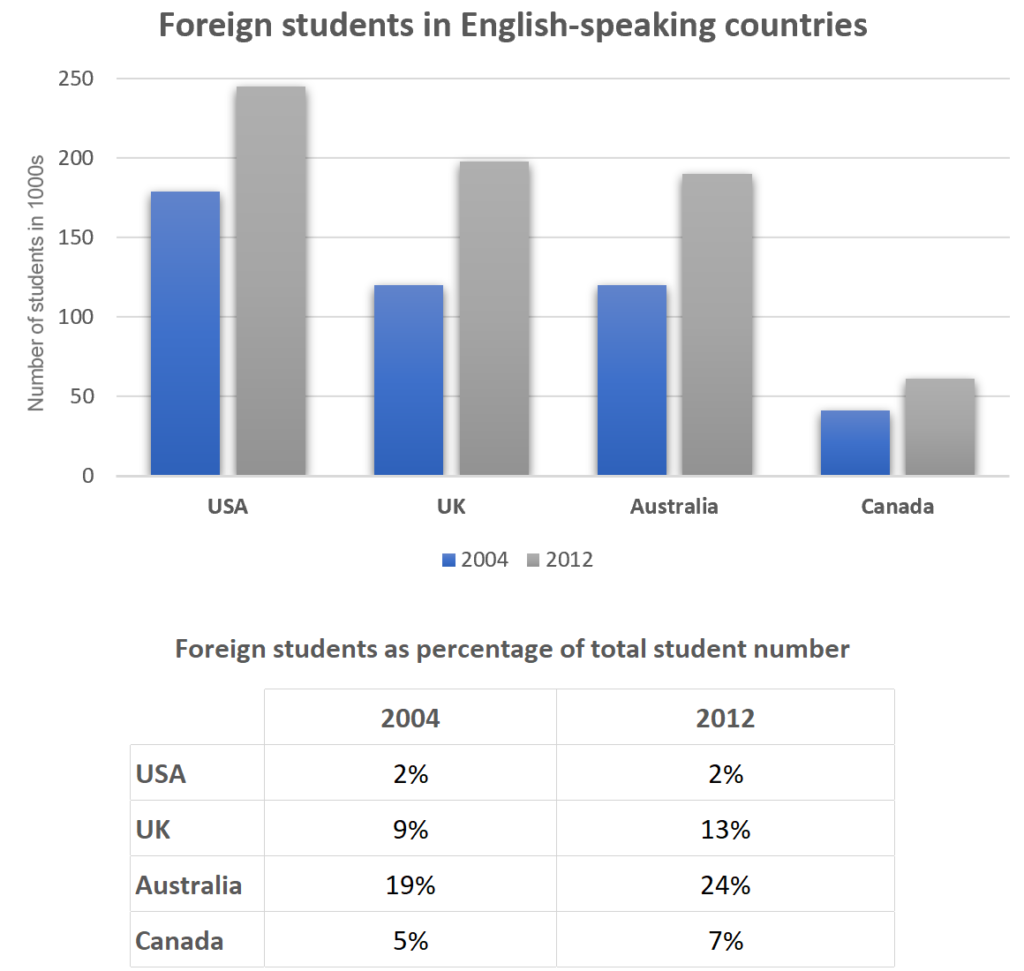
The provided bar chart and table comprehensively depict the number and proportion of non-native students enrolled in higher education across four prominent English-speaking nations during the years 2004 and 2012: the United States, the United Kingdom, Australia, and Canada. Figures are represented in thousands (1000s).
Evidently, the United States boasted the highest enrolment of international students, starkly contrasting with Canada, which recorded the lowest figures. Notably, Australia exhibited the highest percentage of global student intake, while the United States held the lowest proportion.
Specifically, the United States hosted approximately 180,000 foreign students in 2004, a figure that surged to nearly 250,000 by 2012, consistently representing 2% of the total student populace. Meanwhile, the United Kingdom welcomed 120,000 expat students in 2004, constituting 9% of the national student body, a proportion that expanded to 13% in 2012, nearing a count of 200,000.
Conversely, Canada experienced the most modest numbers, accommodating around 40,000 and 60,000 immigrant students in 2004 and 2012, respectively, constituting 5% and 7% of the overall student populace. Remarkably, Australia exhibited the highest rates, with 19% in 2004 and 24% in 2012, amounting to approximately 120,000 and 190,000 students, respectively.